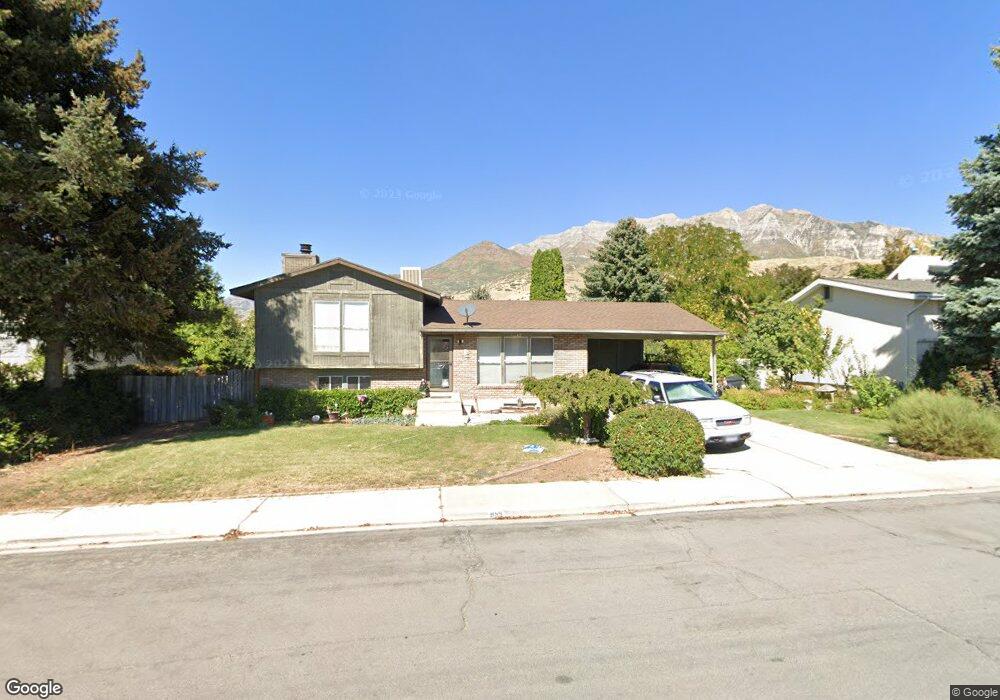
959 E 1030 N Orem, UT 84097
Old Orchard NeighborhoodEstimated Value: $480,653 - $526,000
2
Beds
2
Baths
1,013
Sq Ft
$496/Sq Ft
Est. Value
About This Home
This home is located at 959 E 1030 N, Orem, UT 84097 and is currently estimated at $502,884, approximately $496 per square foot. 959 E 1030 N is a home located in Utah County with nearby schools including Foothill Elementary School, Canyon View Junior High School, and Orem High School.
Ownership History
Date
Name
Owned For
Owner Type
Purchase Details
Closed on
Aug 13, 2003
Sold by
Mecham Randell
Bought by
Mecham Randell K and Mecham Deborah C
Current Estimated Value
Home Financials for this Owner
Home Financials are based on the most recent Mortgage that was taken out on this home.
Original Mortgage
$69,988
Outstanding Balance
$30,078
Interest Rate
5.29%
Mortgage Type
Purchase Money Mortgage
Estimated Equity
$472,806
Purchase Details
Closed on
Jul 23, 1998
Sold by
Mecham Randall K and Mecham Randell K
Bought by
Mecham Randell K and Mecham Deborah C
Home Financials for this Owner
Home Financials are based on the most recent Mortgage that was taken out on this home.
Original Mortgage
$40,000
Interest Rate
7.01%
Create a Home Valuation Report for This Property
The Home Valuation Report is an in-depth analysis detailing your home's value as well as a comparison with similar homes in the area
Home Values in the Area
Average Home Value in this Area
Purchase History
| Date | Buyer | Sale Price | Title Company |
|---|---|---|---|
| Mecham Randell K | -- | Equity Title Agency Inc | |
| Mecham Randell | -- | Equity Title Agency Inc | |
| Mecham Randell K | -- | -- |
Source: Public Records
Mortgage History
| Date | Status | Borrower | Loan Amount |
|---|---|---|---|
| Open | Mecham Randell | $69,988 | |
| Closed | Mecham Randell K | $40,000 |
Source: Public Records
Tax History
| Year | Tax Paid | Tax Assessment Tax Assessment Total Assessment is a certain percentage of the fair market value that is determined by local assessors to be the total taxable value of land and additions on the property. | Land | Improvement |
|---|---|---|---|---|
| 2025 | $1,957 | $247,720 | -- | -- |
| 2024 | $1,957 | $239,305 | $0 | $0 |
| 2023 | $1,787 | $234,795 | $0 | $0 |
| 2022 | $1,896 | $241,450 | $0 | $0 |
| 2021 | $1,587 | $306,100 | $140,000 | $166,100 |
| 2020 | $1,450 | $274,800 | $112,000 | $162,800 |
| 2019 | $1,341 | $264,300 | $101,500 | $162,800 |
| 2018 | $1,272 | $239,600 | $98,000 | $141,600 |
| 2017 | $1,181 | $119,185 | $0 | $0 |
| 2016 | $1,142 | $106,260 | $0 | $0 |
| 2015 | $1,081 | $95,095 | $0 | $0 |
| 2014 | $1,070 | $93,665 | $0 | $0 |
Source: Public Records
Map
Nearby Homes
- 710 E 1280 N
- 1324 N 750 E Unit 3
- 733 E 1450 N Unit 5
- 1356 N 750 E Unit 11
- 976 N 560 E
- 1366 N 750 E
- 747 E 1500 N Unit 13
- 713 E 1450 N Unit 23
- 713 E 1500 St N Unit 19
- 551 N 900 E
- 723 E 1450 N Unit 25
- 471 E 700 N
- 372 E 1165 N
- 1643 N Mountain Oaks Dr
- 566 N Bella Vista Dr
- 362 E 800 N Unit 1
- 453 N 650 E
- 1480 N 430 E
- 1371 N 330 E Unit 8
- 363 E 1395 N Unit 22
Your Personal Tour Guide
Ask me questions while you tour the home.