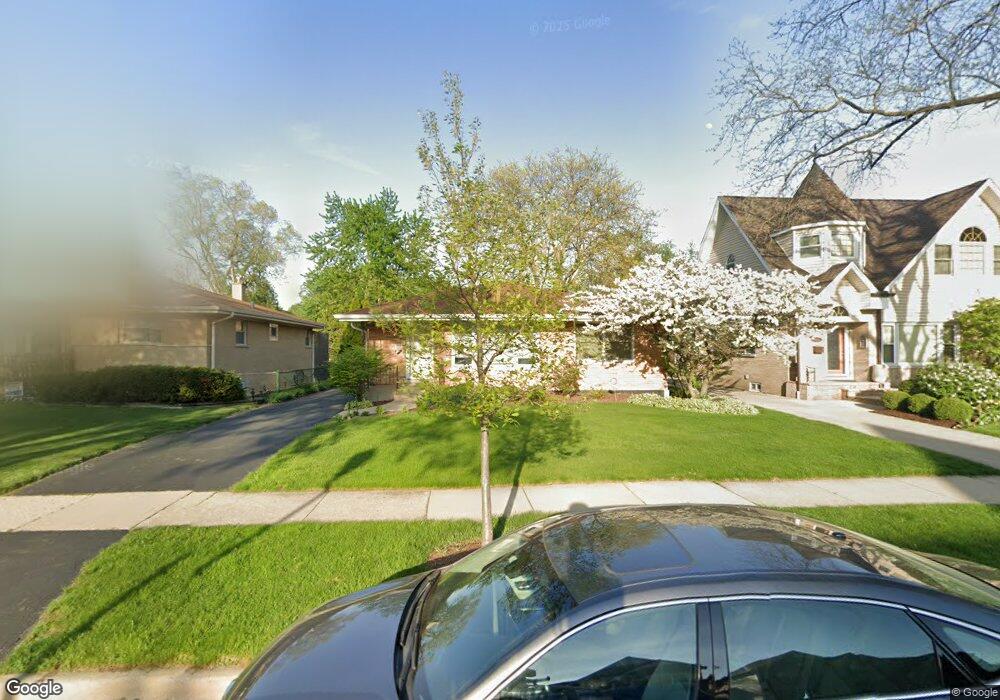
959 S Saylor Ave Elmhurst, IL 60126
Estimated Value: $503,306 - $620,000
Studio
--
Bath
1,200
Sq Ft
$472/Sq Ft
Est. Value
About This Home
This home is located at 959 S Saylor Ave, Elmhurst, IL 60126 and is currently estimated at $566,327, approximately $471 per square foot. 959 S Saylor Ave is a home located in DuPage County with nearby schools including Jackson Elementary School, Bryan Middle School, and York Community High School.
Ownership History
Date
Name
Owned For
Owner Type
Purchase Details
Closed on
Nov 21, 2018
Sold by
Pechanio Matthew P and Pechanio Kristina L
Bought by
Pechanio Kristina L
Current Estimated Value
Home Financials for this Owner
Home Financials are based on the most recent Mortgage that was taken out on this home.
Original Mortgage
$200,000
Outstanding Balance
$124,820
Interest Rate
4.37%
Mortgage Type
New Conventional
Estimated Equity
$441,507
Purchase Details
Closed on
Mar 11, 2002
Sold by
Pope Earl E and Pope Geraldine M
Bought by
Pechanio Matthew P and Pechanio Kristina L
Home Financials for this Owner
Home Financials are based on the most recent Mortgage that was taken out on this home.
Original Mortgage
$198,000
Interest Rate
7.11%
Purchase Details
Closed on
Dec 4, 2001
Sold by
Pope Earl E and Pope Geraldine M
Bought by
Pope Earl E and Pope Geraldine M
Create a Home Valuation Report for This Property
The Home Valuation Report is an in-depth analysis detailing your home's value as well as a comparison with similar homes in the area
Home Values in the Area
Average Home Value in this Area
Purchase History
| Date | Buyer | Sale Price | Title Company |
|---|---|---|---|
| Pechanio Kristina L | -- | National Title Solutions Inc | |
| Pechanio Matthew P | $253,000 | -- | |
| Pope Earl E | -- | -- |
Source: Public Records
Mortgage History
| Date | Status | Borrower | Loan Amount |
|---|---|---|---|
| Open | Pechanio Kristina L | $200,000 | |
| Closed | Pechanio Matthew P | $198,000 |
Source: Public Records
Tax History
| Year | Tax Paid | Tax Assessment Tax Assessment Total Assessment is a certain percentage of the fair market value that is determined by local assessors to be the total taxable value of land and additions on the property. | Land | Improvement |
|---|---|---|---|---|
| 2024 | $8,871 | $155,192 | $87,961 | $67,231 |
| 2023 | $8,227 | $143,510 | $81,340 | $62,170 |
| 2022 | $8,002 | $137,960 | $78,190 | $59,770 |
| 2021 | $7,802 | $134,530 | $76,250 | $58,280 |
| 2020 | $7,498 | $131,580 | $74,580 | $57,000 |
| 2019 | $7,336 | $125,100 | $70,910 | $54,190 |
| 2018 | $6,997 | $118,950 | $67,120 | $51,830 |
| 2017 | $6,840 | $113,350 | $63,960 | $49,390 |
| 2016 | $6,690 | $106,780 | $60,250 | $46,530 |
| 2015 | $6,616 | $99,480 | $56,130 | $43,350 |
| 2014 | $7,101 | $98,150 | $44,550 | $53,600 |
| 2013 | $7,026 | $99,530 | $45,180 | $54,350 |
Source: Public Records
Map
Nearby Homes
- 936 S Mitchell Ave
- 868 S Spring Rd
- 849 S Swain Ave
- 878 S Parkside Ave
- 881 S Bryan St
- 101 W Jackson St
- 110 W Butterfield Rd Unit 502S
- 857 S Euclid Ave
- 742 S Saylor Ave
- 745 S Hillside Ave
- 769 S Fairview Ave
- 696 S Prospect Ave
- 1200 S Prospect Ave Unit 108
- 465 W Verret St
- 688 S Mitchell Ave
- 680 S Bryan St
- 722 S Berkley Ave
- 1S045 Spring Rd Unit H2
- 1S045 Spring Rd Unit 1D
- 1S055 Spring Rd Unit 2C
- 955 S Saylor Ave
- 967 S Saylor Ave
- 949 S Saylor Ave
- 971 S Saylor Ave
- 966 S Saylor Ave
- 960 S Sayor Ave
- 954 S Saylor Ave
- 960 S Saylor Ave
- 945 S Saylor Ave
- 958 S Swain Ave
- 954 S Swain Ave
- 950 S Swain Ave
- 950 S Saylor Ave
- 962 S Swain Ave
- 975 S Saylor Ave
- 966 S Swain Ave
- 941 S Saylor Ave
- 970 S Saylor Ave
- 944 S Saylor Ave
- 970 S Swain Ave
Your Personal Tour Guide
Ask me questions while you tour the home.