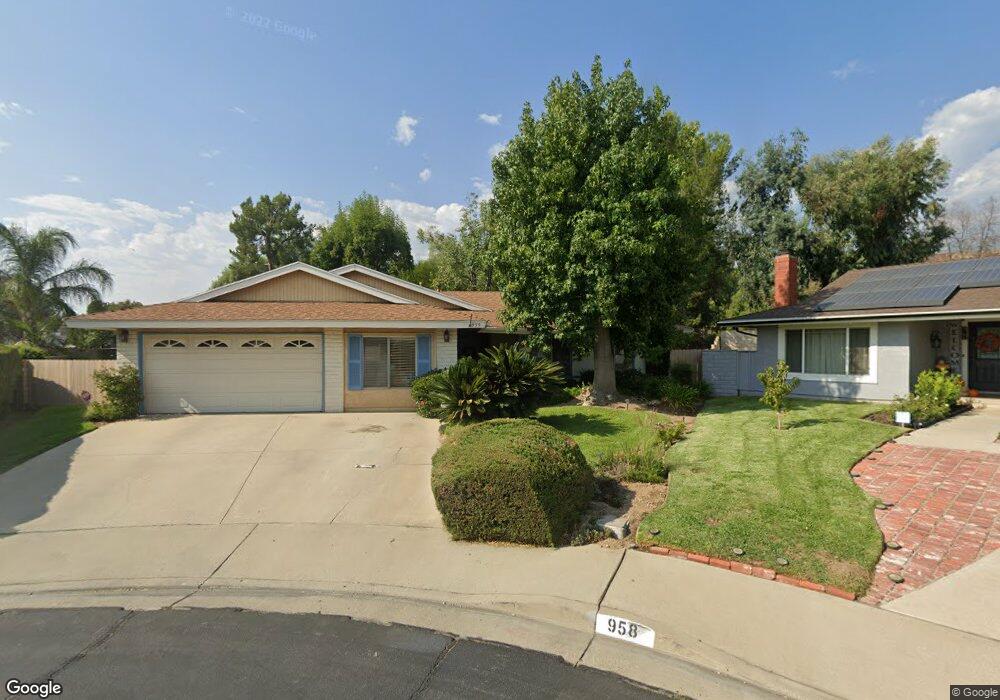
959 Sonora Ct San Dimas, CA 91773
Estimated Value: $843,209 - $1,025,000
3
Beds
2
Baths
1,535
Sq Ft
$596/Sq Ft
Est. Value
About This Home
This home is located at 959 Sonora Ct, San Dimas, CA 91773 and is currently estimated at $915,052, approximately $596 per square foot. 959 Sonora Ct is a home located in Los Angeles County with nearby schools including Allen Avenue Elementary School, Lone Hill Middle School, and San Dimas High School.
Ownership History
Date
Name
Owned For
Owner Type
Purchase Details
Closed on
Jun 7, 2013
Sold by
Kemp Edward L
Bought by
Kemp Cynthia R
Current Estimated Value
Home Financials for this Owner
Home Financials are based on the most recent Mortgage that was taken out on this home.
Original Mortgage
$312,000
Interest Rate
4.55%
Mortgage Type
New Conventional
Purchase Details
Closed on
Nov 25, 2009
Sold by
Kemp Edward Lloyd and Kemp Cynthia Roberta
Bought by
Kemp Edward L and Kemp Cynthia R
Home Financials for this Owner
Home Financials are based on the most recent Mortgage that was taken out on this home.
Original Mortgage
$300,000
Interest Rate
5.01%
Mortgage Type
New Conventional
Purchase Details
Closed on
Mar 13, 2005
Sold by
Kemp Edward L and Kemp Cynthia R
Bought by
Kemp Edward Lloyd and Kemp Cynthia Robert
Create a Home Valuation Report for This Property
The Home Valuation Report is an in-depth analysis detailing your home's value as well as a comparison with similar homes in the area
Home Values in the Area
Average Home Value in this Area
Purchase History
| Date | Buyer | Sale Price | Title Company |
|---|---|---|---|
| Kemp Cynthia R | -- | Usa National Title | |
| Kemp Edward L | -- | Provident Title Company | |
| Kemp Edward Lloyd | -- | -- |
Source: Public Records
Mortgage History
| Date | Status | Borrower | Loan Amount |
|---|---|---|---|
| Closed | Kemp Cynthia R | $312,000 | |
| Closed | Kemp Edward L | $300,000 |
Source: Public Records
Tax History Compared to Growth
Tax History
| Year | Tax Paid | Tax Assessment Tax Assessment Total Assessment is a certain percentage of the fair market value that is determined by local assessors to be the total taxable value of land and additions on the property. | Land | Improvement |
|---|---|---|---|---|
| 2025 | $3,309 | $244,012 | $97,602 | $146,410 |
| 2024 | $3,309 | $239,229 | $95,689 | $143,540 |
| 2023 | $3,237 | $234,539 | $93,813 | $140,726 |
| 2022 | $3,181 | $229,941 | $91,974 | $137,967 |
| 2021 | $3,112 | $225,433 | $90,171 | $135,262 |
| 2019 | $3,052 | $218,749 | $87,498 | $131,251 |
| 2018 | $2,861 | $214,461 | $85,783 | $128,678 |
| 2016 | $2,743 | $206,134 | $82,452 | $123,682 |
| 2015 | $2,702 | $203,039 | $81,214 | $121,825 |
| 2014 | $2,686 | $199,063 | $79,624 | $119,439 |
Source: Public Records
Map
Nearby Homes
- 833 N Oceanbluff Ave
- 750 N Northcape Ave
- 1136 Cherokee Ct
- 953 Alleghany Cir
- 562 E Allen Ave
- 629 Calaveras Rd
- 0 Dallas Rd Unit WS25141209
- 422 E Payson St
- 555 Canyon Hill Rd
- 1287 Whisperglen Ln
- 208 E 3rd St
- 237 Maverick Dr
- 1255 Bonnie Glen Ln
- 2556 Charford St
- 610 E Payson St
- 411 Heatherglen Ln
- 727 Glenlea St
- 1302 Sierra View Dr
- 761 Fordland Ave
- 409 W 4th St