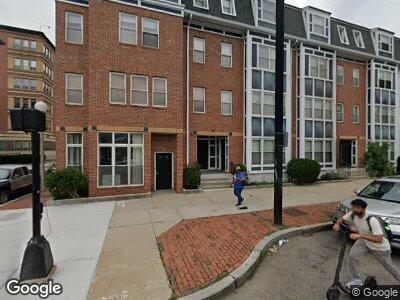
959 Tremont St Unit 1 Roxbury Crossing, MA 02120
Lower Roxbury NeighborhoodEstimated Value: $344,000 - $973,000
2
Beds
2
Baths
1,149
Sq Ft
$488/Sq Ft
Est. Value
About This Home
This home is located at 959 Tremont St Unit 1, Roxbury Crossing, MA 02120 and is currently estimated at $560,818, approximately $488 per square foot. 959 Tremont St Unit 1 is a home located in Suffolk County with nearby schools including Edward M. Kennedy Academy for Health Careers.
Ownership History
Date
Name
Owned For
Owner Type
Purchase Details
Closed on
Feb 28, 2001
Sold by
Madison Davenport Inc
Bought by
Fania Eskinder T
Current Estimated Value
Home Financials for this Owner
Home Financials are based on the most recent Mortgage that was taken out on this home.
Original Mortgage
$102,500
Interest Rate
7%
Mortgage Type
Purchase Money Mortgage
Create a Home Valuation Report for This Property
The Home Valuation Report is an in-depth analysis detailing your home's value as well as a comparison with similar homes in the area
Home Values in the Area
Average Home Value in this Area
Purchase History
| Date | Buyer | Sale Price | Title Company |
|---|---|---|---|
| Fania Eskinder T | $107,900 | -- |
Source: Public Records
Mortgage History
| Date | Status | Borrower | Loan Amount |
|---|---|---|---|
| Open | Fanta Eskinder T | $189,000 | |
| Closed | Fania Eskinder T | $140,000 | |
| Closed | Fania Eskinder T | $160,000 | |
| Closed | Fania Eskinder T | $102,500 |
Source: Public Records
Tax History Compared to Growth
Tax History
| Year | Tax Paid | Tax Assessment Tax Assessment Total Assessment is a certain percentage of the fair market value that is determined by local assessors to be the total taxable value of land and additions on the property. | Land | Improvement |
|---|---|---|---|---|
| 2025 | $3,318 | $286,500 | $0 | $286,500 |
| 2024 | $2,975 | $272,900 | $0 | $272,900 |
| 2023 | $2,791 | $259,900 | $0 | $259,900 |
| 2022 | $2,693 | $247,500 | $0 | $247,500 |
| 2021 | $2,515 | $235,700 | $0 | $235,700 |
| 2020 | $2,371 | $224,500 | $0 | $224,500 |
| 2019 | $2,253 | $213,800 | $0 | $213,800 |
| 2018 | $2,134 | $203,600 | $0 | $203,600 |
| 2017 | $2,053 | $193,900 | $0 | $193,900 |
| 2016 | $2,032 | $184,700 | $0 | $184,700 |
| 2015 | $2,130 | $175,900 | $0 | $175,900 |
| 2014 | $2,107 | $167,500 | $0 | $167,500 |
Source: Public Records
Map
Nearby Homes
- 1011 Tremont St
- 1027 Tremont St
- 57 Greenwich St
- 55 Greenwich St Unit 3
- 257 Northampton St Unit U509
- 257 Northampton St Unit 308
- 263-265 Northampton St Unit 206
- 531 Massachusetts Ave Unit 1
- 465 Massachusetts Ave Unit 4
- 455 Massachusetts Ave Unit 4
- 451-453 Massachusetts Ave Unit 8
- 492 Massachusetts Ave Unit 63
- 771 Tremont St Unit 2
- 196 W Springfield St Unit 1
- 200 W Springfield St Unit 4
- 768 Tremont St
- 177 Northampton St Unit 4
- 220 W Springfield St Unit 4
- 565 Massachusetts Ave Unit 5
- 566 Columbus Ave Unit 405
- 959 Tremont St Unit 5
- 959 Tremont St Unit 4
- 959 Tremont St Unit 3
- 959 Tremont St Unit 2
- 959 Tremont St Unit 1
- 957 Tremont St Unit 4
- 957 Tremont St Unit 3
- 957 Tremont St Unit 2
- 957 Tremont St Unit 1
- 961 Tremont St Unit 1
- 955 Tremont St Unit 4
- 955 Tremont St Unit 3
- 955 Tremont St Unit 2
- 955 Tremont St Unit 1
- 951 Tremont St Unit 1
- 971 Tremont St Unit 971A
- 971 Tremont St Unit E206
- 971 Tremont St Unit E114
- 971 Tremont St Unit E312
- 971 Tremont St