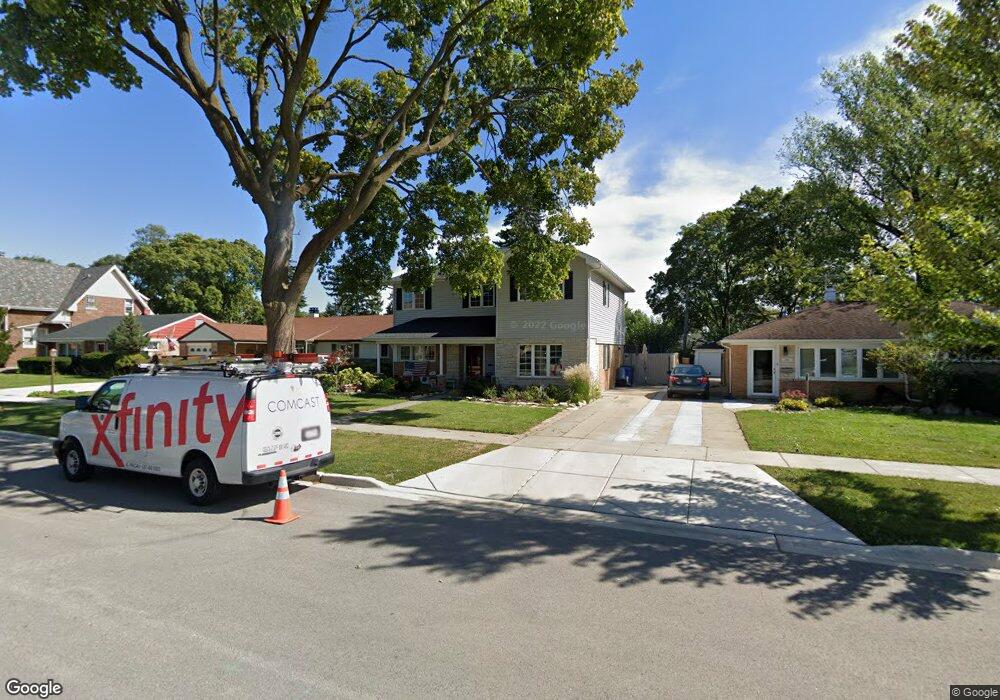
959 W Grant Dr Des Plaines, IL 60016
Estimated Value: $386,000 - $678,000
5
Beds
2
Baths
3,186
Sq Ft
$178/Sq Ft
Est. Value
About This Home
This home is located at 959 W Grant Dr, Des Plaines, IL 60016 and is currently estimated at $568,516, approximately $178 per square foot. 959 W Grant Dr is a home located in Cook County with nearby schools including Forest Elementary School, Algonquin Middle School, and Maine West High School.
Ownership History
Date
Name
Owned For
Owner Type
Purchase Details
Closed on
Dec 29, 2006
Sold by
Stettner Thomas R
Bought by
Stettner Thomas and Stettner Allison
Current Estimated Value
Home Financials for this Owner
Home Financials are based on the most recent Mortgage that was taken out on this home.
Original Mortgage
$280,000
Outstanding Balance
$166,861
Interest Rate
6.16%
Mortgage Type
New Conventional
Estimated Equity
$401,655
Purchase Details
Closed on
Jun 16, 1994
Sold by
Ohara Daniel P and Ohara Julie A
Bought by
Stettner Thomas R
Home Financials for this Owner
Home Financials are based on the most recent Mortgage that was taken out on this home.
Original Mortgage
$117,000
Interest Rate
8.61%
Create a Home Valuation Report for This Property
The Home Valuation Report is an in-depth analysis detailing your home's value as well as a comparison with similar homes in the area
Home Values in the Area
Average Home Value in this Area
Purchase History
| Date | Buyer | Sale Price | Title Company |
|---|---|---|---|
| Stettner Thomas | -- | 1St American Title | |
| Stettner Thomas R | $131,000 | -- |
Source: Public Records
Mortgage History
| Date | Status | Borrower | Loan Amount |
|---|---|---|---|
| Open | Stettner Thomas | $280,000 | |
| Closed | Stettner Thomas R | $117,000 |
Source: Public Records
Tax History Compared to Growth
Tax History
| Year | Tax Paid | Tax Assessment Tax Assessment Total Assessment is a certain percentage of the fair market value that is determined by local assessors to be the total taxable value of land and additions on the property. | Land | Improvement |
|---|---|---|---|---|
| 2024 | $11,254 | $46,000 | $5,148 | $40,852 |
| 2023 | $10,956 | $46,000 | $5,148 | $40,852 |
| 2022 | $10,956 | $46,000 | $5,148 | $40,852 |
| 2021 | $10,778 | $35,062 | $4,290 | $30,772 |
| 2020 | $10,596 | $35,062 | $4,290 | $30,772 |
| 2019 | $10,602 | $39,396 | $4,290 | $35,106 |
| 2018 | $9,671 | $32,337 | $3,775 | $28,562 |
| 2017 | $9,500 | $32,337 | $3,775 | $28,562 |
| 2016 | $8,986 | $32,337 | $3,775 | $28,562 |
| 2015 | $8,578 | $28,376 | $3,260 | $25,116 |
| 2014 | $8,398 | $28,376 | $3,260 | $25,116 |
| 2013 | $8,189 | $28,376 | $3,260 | $25,116 |
Source: Public Records
Map
Nearby Homes
- 911 E Villa Dr
- 1056 E Villa Dr
- 858 E Grant Dr
- 714 E Thacker St
- 1157 W Grant Dr
- 881 E Thacker St
- 906 Alfini Dr
- 886 E Thacker St
- 520 E Thacker St
- 1205 S Wolf Rd
- 434 E Thacker St
- 508 Crestwood Dr
- 514 S 4th Ave
- 1394 Carol Ln
- 648 1st Ave
- 915 Graceland Ave Unit 1E
- 879 North Ave
- 505 Forest Ave
- 1057 Hollywood Ave
- 991 Wicke Ave
- 953 W Grant Dr
- 965 W Grant Dr
- 949 W Grant Dr
- 975 W Grant Dr
- 952 W Villa Dr
- 964 W Villa Dr
- 945 W Grant Dr
- 983 W Grant Dr
- 972 W Villa Dr
- 936 W Villa Dr
- 79 Nicholas Dr W Unit D
- 47 Nicholas Dr W Unit B
- 45 Nicholas Dr W Unit C
- 35 Nicholas Dr W
- 71 Nicholas Dr W
- 41 Nicholas Dr W
- 69 Nicholas Dr W
- 81 Nicholas Dr W
- 73 Nicholas Dr W
- 71 Nicholas Dr W Unit B