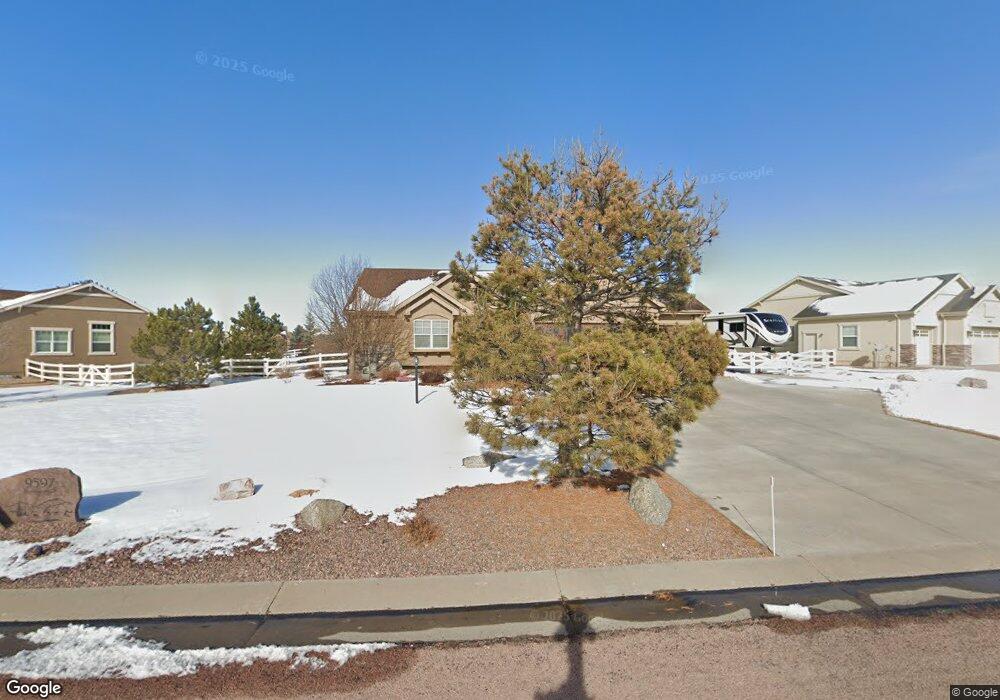
9597 Rockingham Dr Peyton, CO 80831
Falcon NeighborhoodEstimated Value: $674,000 - $756,000
3
Beds
3
Baths
3,952
Sq Ft
$178/Sq Ft
Est. Value
About This Home
This home is located at 9597 Rockingham Dr, Peyton, CO 80831 and is currently estimated at $703,111, approximately $177 per square foot. 9597 Rockingham Dr is a home located in El Paso County with nearby schools including Bennett Ranch Elementary School, Falcon Middle School, and Falcon High School.
Ownership History
Date
Name
Owned For
Owner Type
Purchase Details
Closed on
Jul 29, 2016
Sold by
Grady Christopher C and Grady Linda G
Bought by
Darnell Brad L and Darnell Rebecca J
Current Estimated Value
Home Financials for this Owner
Home Financials are based on the most recent Mortgage that was taken out on this home.
Original Mortgage
$29,201
Outstanding Balance
$23,344
Interest Rate
3.54%
Mortgage Type
New Conventional
Estimated Equity
$679,767
Purchase Details
Closed on
Apr 3, 2009
Sold by
Campbell Homes Llc
Bought by
Grady Christopher C and Grady Linda G
Home Financials for this Owner
Home Financials are based on the most recent Mortgage that was taken out on this home.
Original Mortgage
$352,000
Interest Rate
5.14%
Mortgage Type
Unknown
Create a Home Valuation Report for This Property
The Home Valuation Report is an in-depth analysis detailing your home's value as well as a comparison with similar homes in the area
Home Values in the Area
Average Home Value in this Area
Purchase History
| Date | Buyer | Sale Price | Title Company |
|---|---|---|---|
| Darnell Brad L | $462,500 | Unified Title Co | |
| Grady Christopher C | $446,800 | Peoples National Title Llc |
Source: Public Records
Mortgage History
| Date | Status | Borrower | Loan Amount |
|---|---|---|---|
| Open | Darnell Brad L | $29,201 | |
| Previous Owner | Grady Christopher C | $352,000 |
Source: Public Records
Tax History Compared to Growth
Tax History
| Year | Tax Paid | Tax Assessment Tax Assessment Total Assessment is a certain percentage of the fair market value that is determined by local assessors to be the total taxable value of land and additions on the property. | Land | Improvement |
|---|---|---|---|---|
| 2025 | $3,827 | $45,650 | -- | -- |
| 2024 | $3,633 | $46,460 | $6,420 | $40,040 |
| 2023 | $3,633 | $46,460 | $6,420 | $40,040 |
| 2022 | $2,919 | $32,120 | $5,020 | $27,100 |
| 2021 | $3,103 | $33,050 | $5,170 | $27,880 |
| 2020 | $3,213 | $31,460 | $4,680 | $26,780 |
| 2019 | $3,149 | $31,460 | $4,680 | $26,780 |
| 2018 | $3,247 | $31,650 | $3,780 | $27,870 |
| 2017 | $3,055 | $31,650 | $3,780 | $27,870 |
| 2016 | $3,318 | $34,990 | $4,180 | $30,810 |
| 2015 | $3,462 | $34,990 | $4,180 | $30,810 |
| 2014 | $3,187 | $31,810 | $4,300 | $27,510 |
Source: Public Records
Map
Nearby Homes
- 9807 Rockingham Dr
- 9983 Keating Dr
- 9740 Aberdale Ct
- 10031 Henman Terrace
- 10055 Henman Terrace
- 10113 Keynes Dr
- 10047 Keynes Dr
- 10973 Caverhill Dr
- 9880 Jaggar Way
- 9936 Jaggar Way
- 10157 Keynes Dr
- 10060 Kingsbury Dr
- 9808 Jaggar Way
- 10068 Beckham St
- 10169 Kingsbury Dr
- Tourmaline Plan at Paint Brush Hills
- Agate Plan at Paint Brush Hills
- Moonstone Plan at Paint Brush Hills
- Ammolite Plan at Paint Brush Hills
- Lapis Plan at Paint Brush Hills
- 9583 Rockingham Dr
- 9625 Rockingham Dr
- 9646 Keating Dr
- 9639 Rockingham Dr
- 9596 Rockingham Dr
- 9662 Keating Dr
- 9582 Rockingham Dr
- 9653 Rockingham Dr
- 9615 Keating Dr
- 9631 Keating Dr
- 9647 Keating Dr
- 9568 Rockingham Dr
- 9624 Rockingham Dr
- 9678 Keating Dr
- 9667 Rockingham Dr
- 9663 Keating Dr
- 9638 Rockingham Dr
- 9554 Rockingham Dr
- 9694 Keating Dr
- 9679 Keating Dr