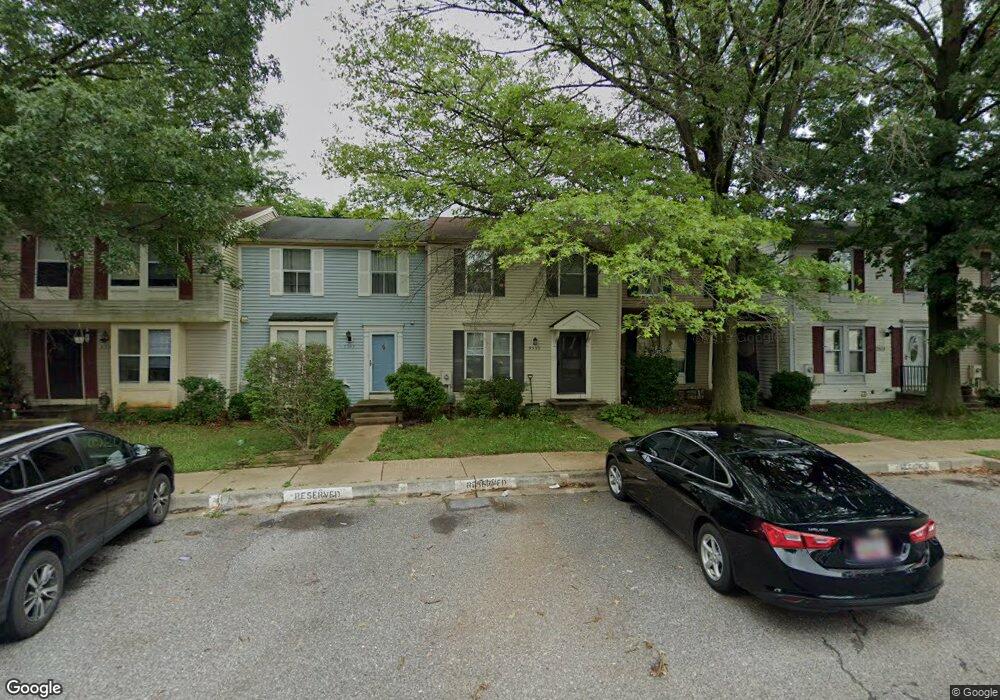
9599 Quarry Bridge Ct Columbia, MD 21046
Estimated Value: $356,000 - $378,326
--
Bed
2
Baths
1,120
Sq Ft
$326/Sq Ft
Est. Value
About This Home
This home is located at 9599 Quarry Bridge Ct, Columbia, MD 21046 and is currently estimated at $364,832, approximately $325 per square foot. 9599 Quarry Bridge Ct is a home located in Howard County with nearby schools including Guilford Elementary School, Lake Elkhorn Middle School, and Hammond High School.
Ownership History
Date
Name
Owned For
Owner Type
Purchase Details
Closed on
Mar 31, 2021
Sold by
Mcdonald Carver Heather A and Mcdonald Heather A
Bought by
Moultrie Justin
Current Estimated Value
Home Financials for this Owner
Home Financials are based on the most recent Mortgage that was taken out on this home.
Original Mortgage
$263,392
Outstanding Balance
$237,811
Interest Rate
3%
Mortgage Type
FHA
Estimated Equity
$127,021
Purchase Details
Closed on
Aug 2, 2005
Sold by
Henry Stephanie M
Bought by
Mcdonald Heather A
Home Financials for this Owner
Home Financials are based on the most recent Mortgage that was taken out on this home.
Original Mortgage
$200,000
Interest Rate
5.59%
Mortgage Type
New Conventional
Purchase Details
Closed on
Jun 14, 2002
Sold by
Mulhare Richard J
Bought by
Henry Stephanie M
Purchase Details
Closed on
Jun 19, 1992
Sold by
Jackson Darlene
Bought by
Mulhare Richard J
Create a Home Valuation Report for This Property
The Home Valuation Report is an in-depth analysis detailing your home's value as well as a comparison with similar homes in the area
Home Values in the Area
Average Home Value in this Area
Purchase History
| Date | Buyer | Sale Price | Title Company |
|---|---|---|---|
| Moultrie Justin | $292,500 | Universal Title | |
| Mcdonald Heather A | $250,000 | -- | |
| Henry Stephanie M | $137,900 | -- | |
| Mulhare Richard J | $108,000 | -- |
Source: Public Records
Mortgage History
| Date | Status | Borrower | Loan Amount |
|---|---|---|---|
| Open | Moultrie Justin | $263,392 | |
| Previous Owner | Mcdonald Heather A | $200,000 | |
| Previous Owner | Mcdonald Heather A | $18,000 | |
| Closed | Henry Stephanie M | -- |
Source: Public Records
Tax History Compared to Growth
Tax History
| Year | Tax Paid | Tax Assessment Tax Assessment Total Assessment is a certain percentage of the fair market value that is determined by local assessors to be the total taxable value of land and additions on the property. | Land | Improvement |
|---|---|---|---|---|
| 2025 | $4,287 | $281,400 | $125,000 | $156,400 |
| 2024 | $4,287 | $268,733 | $0 | $0 |
| 2023 | $4,053 | $256,067 | $0 | $0 |
| 2022 | $3,837 | $243,400 | $115,000 | $128,400 |
| 2021 | $3,715 | $234,867 | $0 | $0 |
| 2020 | $3,109 | $226,333 | $0 | $0 |
| 2019 | $3,141 | $217,800 | $82,500 | $135,300 |
| 2018 | $3,187 | $214,033 | $0 | $0 |
| 2017 | $3,083 | $217,800 | $0 | $0 |
| 2016 | -- | $206,500 | $0 | $0 |
| 2015 | -- | $206,500 | $0 | $0 |
| 2014 | -- | $206,500 | $0 | $0 |
Source: Public Records
Map
Nearby Homes
- 9506 Quarry Bridge Ct
- 9519 Oakhurst Dr
- 9538 Oakhurst Dr
- 9609 Glen Oaks Ln
- 9275 Cartersville Rd
- 9602 Hastings Dr
- 9456 Keepsake Way
- 9252 Pirates Cove
- 9278 Pirates Cove
- 9469 Clocktower Ln
- 9339 Wild Grass Ct
- 9218 Connell Ct
- 8025 Camerado Ct
- 7283 Procopio Cir
- 9310 Vollmerhausen Rd
- 9321 Spring Water Path
- 8072 Red Jacket Way
- 7911 Burkard Ln
- 9319 Many Flower Ln
- 8861 Mission Rd
- 9597 Quarry Bridge Ct
- 9595 Quarry Bridge Ct
- 9601 Quarry Bridge Ct
- 9603 Quarry Bridge Ct
- 9605 Quarry Bridge Ct
- 9589 Quarry Bridge Ct
- 9607 Quarry Bridge Ct
- 9587 Quarry Bridge Ct
- 9609 Quarry Bridge Ct
- 9585 Quarry Bridge Ct
- 9583 Quarry Bridge Ct
- 9579 Quarry Bridge Ct
- 9613 Quarry Bridge Ct
- 9615 Quarry Bridge Ct
- 9617 Quarry Bridge Ct
- 9577 Quarry Bridge Ct
- 9619 Quarry Bridge Ct
- 9621 Quarry Bridge Ct
- 9623 Quarry Bridge Ct
- 9575 Quarry Bridge Ct