
Seller's Agent in 2024
Tom McFarland
RE/MAX
(617) 851-0900
2 in this area
88 Total Sales


Estimated Value: $699,000 - $772,000
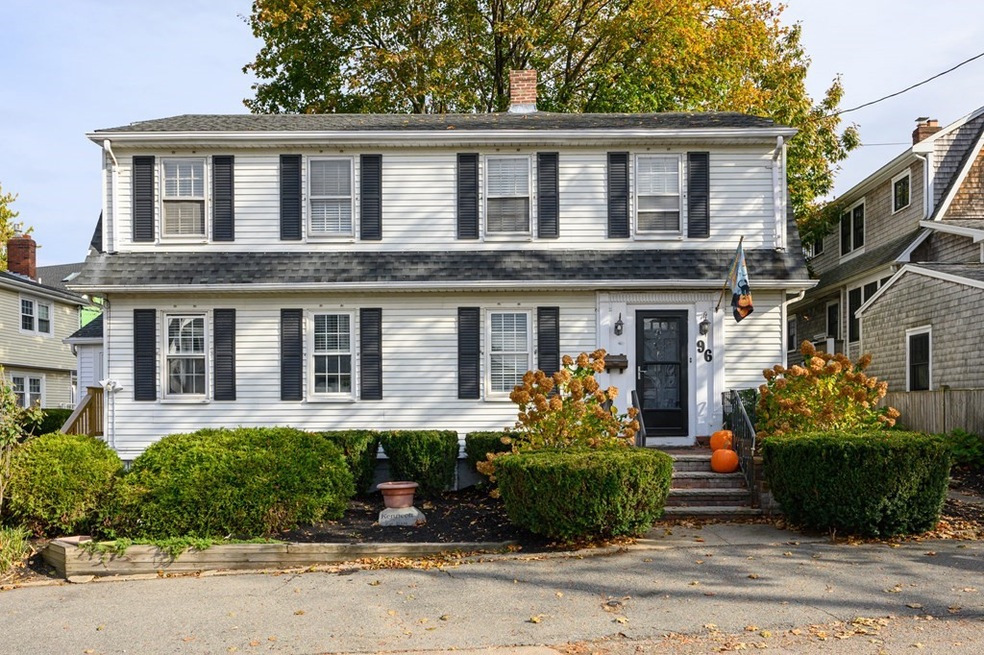
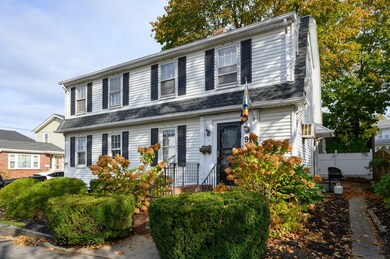
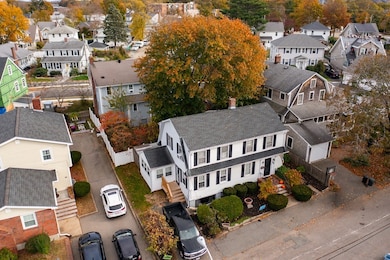
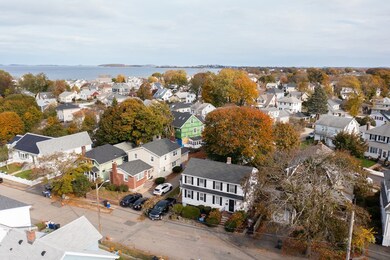
Classic colonial style home nestled in the seaside community of Merrymount. This home flows well with a main level featuring 5 rooms consisting of kitchen with sitting island, adjacent dining room, large living room with beamed ceiling and built ins, sitting den and cathedral sun/tv room (unheated)and half bath. The second floor includes three bedrooms and a full bath. The finished lower level offers in-law potential with family room and kitchen cabinet area with full bath. Walk to private beach, playground and Merrymount Elementary School from this desirable neighborhood. Also a close drive to downtown Quincy and easy access to Boston.
| Date | Buyer | Sale Price | Title Company |
|---|---|---|---|
| Vacca Michelle L | $366,300 | -- | |
| Vacca Michelle L | $366,300 | -- |
| Date | Status | Borrower | Loan Amount |
|---|---|---|---|
| Open | Vacca Michelle L | $329,670 | |
| Closed | Vacca Michelle L | $329,670 |
| Date | Event | Price | List to Sale | Price per Sq Ft |
|---|---|---|---|---|
| 10/25/2024 10/25/24 | Sold | $669,000 | -1.5% | $311 / Sq Ft |
| 08/01/2024 08/01/24 | Pending | -- | -- | -- |
| 07/25/2024 07/25/24 | Price Changed | $679,000 | 0.0% | $316 / Sq Ft |
| 07/25/2024 07/25/24 | For Sale | $679,000 | -4.2% | $316 / Sq Ft |
| 07/16/2024 07/16/24 | Pending | -- | -- | -- |
| 06/06/2024 06/06/24 | Price Changed | $709,000 | -1.4% | $330 / Sq Ft |
| 05/27/2024 05/27/24 | Price Changed | $719,000 | -1.4% | $334 / Sq Ft |
| 05/06/2024 05/06/24 | Price Changed | $729,000 | -1.4% | $339 / Sq Ft |
| 04/11/2024 04/11/24 | Price Changed | $739,000 | -2.6% | $344 / Sq Ft |
| 11/15/2023 11/15/23 | For Sale | $759,000 | -- | $353 / Sq Ft |
| Year | Tax Paid | Tax Assessment Tax Assessment Total Assessment is a certain percentage of the fair market value that is determined by local assessors to be the total taxable value of land and additions on the property. | Land | Improvement |
|---|---|---|---|---|
| 2025 | $7,588 | $658,100 | $304,600 | $353,500 |
| 2024 | $7,029 | $623,700 | $295,800 | $327,900 |
| 2023 | $6,249 | $561,500 | $257,200 | $304,300 |
| 2022 | $6,022 | $502,700 | $214,300 | $288,400 |
| 2021 | $5,811 | $478,700 | $214,300 | $264,400 |
| 2020 | $5,759 | $463,300 | $206,100 | $257,200 |
| 2019 | $5,488 | $437,300 | $192,600 | $244,700 |
| 2018 | $5,144 | $385,600 | $159,900 | $225,700 |
| 2017 | $5,261 | $371,300 | $167,500 | $203,800 |
| 2016 | $5,078 | $353,600 | $164,400 | $189,200 |
| 2015 | $4,773 | $326,900 | $155,100 | $171,800 |
| 2014 | $4,626 | $311,300 | $150,500 | $160,800 |
Seller's Agent in 2024
Tom McFarland
RE/MAX
(617) 851-0900
2 in this area
88 Total Sales
Buyer's Agent in 2024
Yi Chen
Keller Williams Realty
(617) 309-0288
2 in this area
83 Total Sales
Source: MLS Property Information Network (MLS PIN)
MLS Number: 73180569
APN: QUIN-001105Z-000036-C000000
Disclaimer: Certain information contained herein is derived from information provided by parties other than Homes.com. All information provided is deemed reliable, but is not guaranteed to be accurate and should be independently verified.
![]() The property listing data and information, or the Images, set forth herein were provided to MLS Property Information Network, Inc. from third party sources, including sellers, lessors and public records, and were compiled by MLS Property Information Network, Inc. The property listing data and information, and the Images, are for the personal, non-commercial use of consumers having a good faith interest in purchasing or leasing listed properties of the type displayed to them and may not be used for any purpose other than to identify prospective properties which such consumers may have a good faith interest in purchasing or leasing. MLS Property Information Network, Inc. and its subscribers disclaim any and all representations and warranties as to the accuracy of the property listing data and information, or as to the accuracy of any of the Images, set forth herein.
The property listing data and information, or the Images, set forth herein were provided to MLS Property Information Network, Inc. from third party sources, including sellers, lessors and public records, and were compiled by MLS Property Information Network, Inc. The property listing data and information, and the Images, are for the personal, non-commercial use of consumers having a good faith interest in purchasing or leasing listed properties of the type displayed to them and may not be used for any purpose other than to identify prospective properties which such consumers may have a good faith interest in purchasing or leasing. MLS Property Information Network, Inc. and its subscribers disclaim any and all representations and warranties as to the accuracy of the property listing data and information, or as to the accuracy of any of the Images, set forth herein.