96 Blake St Needham, MA 02492
Needham AreaEstimated Value: $1,130,000 - $1,470,000
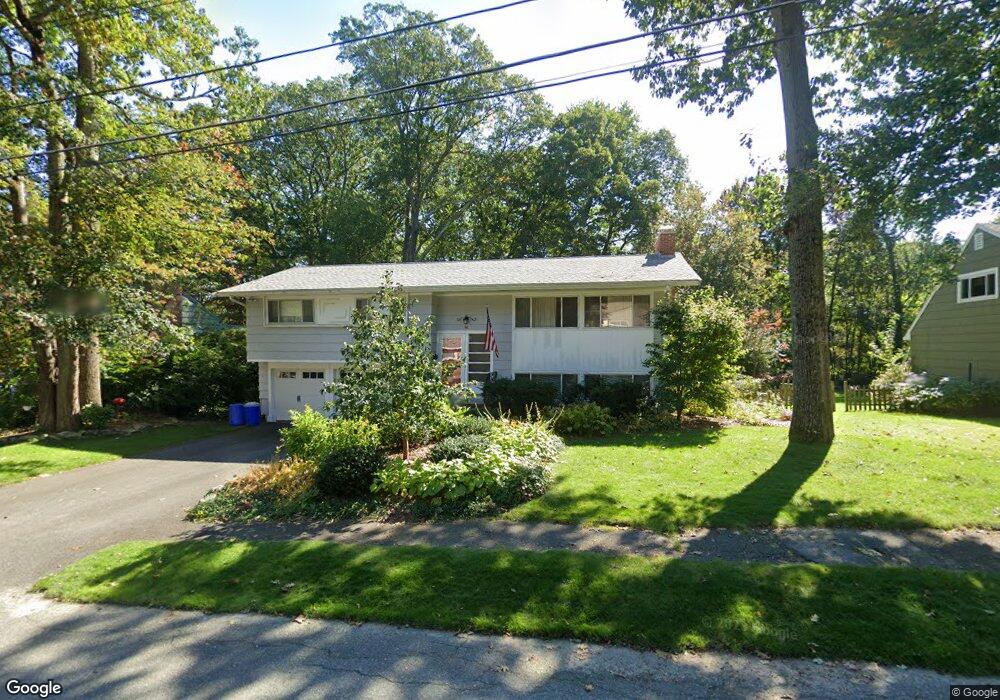
About This Home
This home is located at 96 Blake St, Needham, MA 02492 and is currently estimated at $1,316,570, approximately $816 per square foot. 96 Blake St is a home located in Norfolk County with nearby schools including Newman Elementary School, High Rock Middle School, and Pollard Middle School.
Ownership History
We collect this data history from publicly available records. To have your information removed, we recommend requesting removal directly through your county’s website.
Purchase Details
Purchase Details
Home Values in the Area
Average Home Value in this Area
Purchase History
We collect this data history from publicly available records. To have your information removed, we recommend requesting removal directly through your county’s website.
| Date | Buyer | Sale Price | Title Company |
|---|---|---|---|
| -- | None Available | ||
| $50,000 | -- |
Tax History
We collect this data history from publicly available records. To have your information removed, we recommend requesting removal directly through your county’s website.
| Year | Tax Paid | Tax Assessment Tax Assessment Total Assessment is a certain percentage of the fair market value that is determined by local assessors to be the total taxable value of land and additions on the property. | Land | Improvement |
|---|---|---|---|---|
| 2025 | $10,631 | $1,002,900 | $725,400 | $277,500 |
| 2024 | $10,184 | $813,400 | $529,400 | $284,000 |
| 2023 | $10,342 | $793,100 | $529,400 | $263,700 |
| 2022 | $10,077 | $753,700 | $499,600 | $254,100 |
| 2021 | $9,821 | $753,700 | $499,600 | $254,100 |
| 2020 | $9,786 | $783,500 | $499,600 | $283,900 |
| 2019 | $9,109 | $735,200 | $454,500 | $280,700 |
| 2018 | $8,734 | $735,200 | $454,500 | $280,700 |
| 2017 | $8,329 | $700,500 | $454,500 | $246,000 |
| 2016 | $8,115 | $703,200 | $454,500 | $248,700 |
| 2015 | $7,939 | $703,200 | $454,500 | $248,700 |
| 2014 | $7,646 | $656,900 | $413,500 | $243,400 |
Map
- 105 Blake St
- 91 Henderson St
- 430 High Rock St
- 155 Oak St
- 287 High Rock St
- 456 Chestnut St
- 211 High Rock St
- 298 Marked Tree Rd
- 26 Denmark Ln Unit 26
- 533 Chestnut St
- 620 High Rock St
- 1333 Great Plain Ave
- 21 Gayland Rd
- 1275 Central Ave
- 1360 Great Plain Ave
- 1362 Great Plain Ave Unit 1
- 145 Meadowbrook Rd
- 18 Grant St Unit Rear
- 61 Pleasant St
- 46 Howland St Unit 46
- 60 Oakcrest Rd
- 25 Andrea
- 108 Heather Lane Ext Rc-Lot 4
- 108 Heather Way Lot Rc4
- 777 Confidential St
- Lot 5 Heather Ln
- 110 Blake St
- 61 Oakcrest Rd
- 119 Sylvan Rd
- 125 Sylvan Rd
- 102 Blake St
- 49 Oakcrest Rd
- 26 Harding Rd
- 103 Sylvan Rd
- 20 Harding Rd
- 44 Oakcrest Rd
- 118 Sylvan Rd
- 12 Harding Rd
- 6 Ferndale Rd
- 100 Rosemary Way Unit 309
Ask me questions while you tour the home.