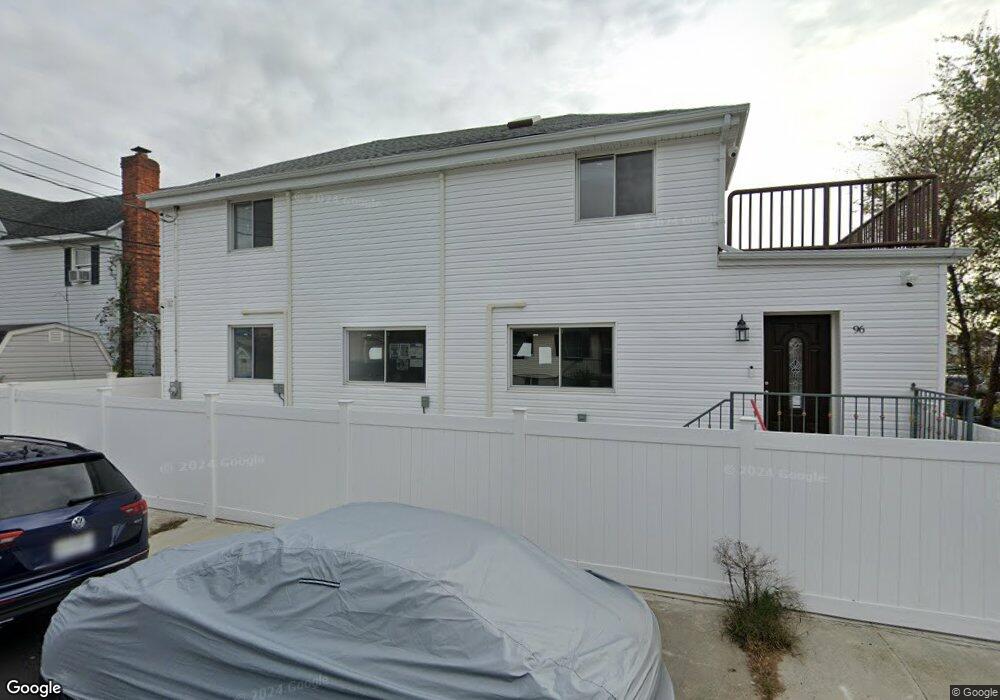
96 Ebony Ct Brooklyn, NY 11229
Gerritsen Beach NeighborhoodEstimated Value: $806,697
Studio
--
Bath
1,456
Sq Ft
$554/Sq Ft
Est. Value
About This Home
This home is located at 96 Ebony Ct, Brooklyn, NY 11229 and is currently estimated at $806,697, approximately $554 per square foot. 96 Ebony Ct is a home located in Kings County with nearby schools including P.S. 277 Gerritsen Beach, J.H.S. 278 Marine Park, and New Visions Charter High School for Advanced Math/ Science.
Ownership History
Date
Name
Owned For
Owner Type
Purchase Details
Closed on
Oct 31, 2022
Sold by
Santan Holdings Corp
Bought by
Ebony Court Llc
Current Estimated Value
Home Financials for this Owner
Home Financials are based on the most recent Mortgage that was taken out on this home.
Original Mortgage
$620,000
Outstanding Balance
$600,739
Interest Rate
6.94%
Mortgage Type
Purchase Money Mortgage
Estimated Equity
$205,958
Purchase Details
Closed on
Oct 2, 2018
Sold by
Brooklyn Props Us Inc
Bought by
Santan Holdings Corp
Purchase Details
Closed on
Jun 1, 2018
Sold by
M Randolph Jackson Esq
Bought by
Brooklyn Properties Us Inc
Purchase Details
Closed on
Mar 4, 2004
Sold by
Massamillo John F
Bought by
Welsh John
Home Financials for this Owner
Home Financials are based on the most recent Mortgage that was taken out on this home.
Original Mortgage
$200,000
Interest Rate
5.71%
Mortgage Type
Commercial
Create a Home Valuation Report for This Property
The Home Valuation Report is an in-depth analysis detailing your home's value as well as a comparison with similar homes in the area
Home Values in the Area
Average Home Value in this Area
Purchase History
| Date | Buyer | Sale Price | Title Company |
|---|---|---|---|
| Ebony Court Llc | $765,000 | -- | |
| Santan Holdings Corp | $410,000 | -- | |
| Brooklyn Properties Us Inc | $280,000 | -- | |
| Welsh John | $500,000 | -- |
Source: Public Records
Mortgage History
| Date | Status | Borrower | Loan Amount |
|---|---|---|---|
| Open | Ebony Court Llc | $620,000 | |
| Previous Owner | Welsh John | $200,000 |
Source: Public Records
Tax History
| Year | Tax Paid | Tax Assessment Tax Assessment Total Assessment is a certain percentage of the fair market value that is determined by local assessors to be the total taxable value of land and additions on the property. | Land | Improvement |
|---|---|---|---|---|
| 2025 | $14,204 | $133,650 | $22,050 | $111,600 |
| 2024 | $14,204 | $134,100 | $22,050 | $112,050 |
| 2023 | $13,127 | $123,300 | $22,050 | $101,250 |
| 2022 | $11,896 | $111,150 | $22,050 | $89,100 |
| 2021 | $10,828 | $101,250 | $22,050 | $79,200 |
| 2020 | $6,016 | $110,700 | $22,050 | $88,650 |
| 2019 | $11,185 | $110,700 | $22,050 | $88,650 |
| 2018 | $10,873 | $108,900 | $22,050 | $86,850 |
| 2017 | $10,598 | $109,800 | $22,050 | $87,750 |
| 2016 | $10,488 | $103,950 | $22,050 | $81,900 |
| 2015 | $7,743 | $98,550 | $22,050 | $76,500 |
| 2014 | $7,743 | $95,850 | $22,050 | $73,800 |
Source: Public Records
Map
Nearby Homes
- 108 Celeste Ct
- 103 Aster Ct
- 2492 Gerritsen Ave
- 103 Fane Ct
- 57 Dictum Ct
- 53 Dictum Ct
- 55 Aster Ct
- 108 Garland Ct
- 3168 Whitney Ave
- 2455 Stuart St
- 3172 Whitney Ave
- 43 Dictum Ct
- 3171 Whitney Ave Unit 1B
- 3171 Whitney Ave Unit 3F
- 2270 Plumb 1st St Unit 6H
- 2270 Plumb 1st St Unit 1B
- 2332 Brigham St
- 37 Celeste Ct
- 2271 Knapp St Unit 5H
- 2271 Knapp St Unit 2E
Your Personal Tour Guide
Ask me questions while you tour the home.