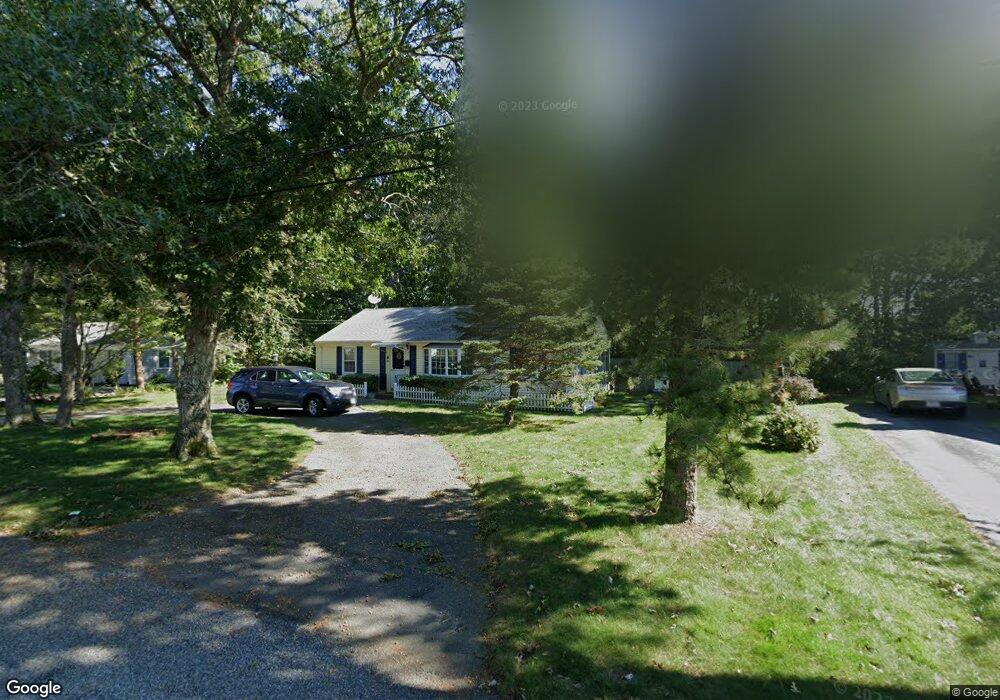
96 Evergreen St South Yarmouth, MA 02664
Estimated Value: $501,000 - $666,000
3
Beds
2
Baths
1,001
Sq Ft
$575/Sq Ft
Est. Value
About This Home
This home is located at 96 Evergreen St, South Yarmouth, MA 02664 and is currently estimated at $575,450, approximately $574 per square foot. 96 Evergreen St is a home located in Barnstable County with nearby schools including Dennis-Yarmouth Regional High School and St. Pius X. School.
Ownership History
Date
Name
Owned For
Owner Type
Purchase Details
Closed on
Sep 29, 1999
Sold by
Mullen Rita C and Mullen James P
Bought by
Fitch Donald D and Fitch Dorothy M
Current Estimated Value
Home Financials for this Owner
Home Financials are based on the most recent Mortgage that was taken out on this home.
Original Mortgage
$112,720
Outstanding Balance
$34,087
Interest Rate
7.85%
Mortgage Type
Purchase Money Mortgage
Estimated Equity
$541,363
Create a Home Valuation Report for This Property
The Home Valuation Report is an in-depth analysis detailing your home's value as well as a comparison with similar homes in the area
Home Values in the Area
Average Home Value in this Area
Purchase History
| Date | Buyer | Sale Price | Title Company |
|---|---|---|---|
| Fitch Donald D | $140,900 | -- |
Source: Public Records
Mortgage History
| Date | Status | Borrower | Loan Amount |
|---|---|---|---|
| Open | Fitch Donald D | $112,720 |
Source: Public Records
Tax History Compared to Growth
Tax History
| Year | Tax Paid | Tax Assessment Tax Assessment Total Assessment is a certain percentage of the fair market value that is determined by local assessors to be the total taxable value of land and additions on the property. | Land | Improvement |
|---|---|---|---|---|
| 2025 | $3,277 | $462,800 | $215,400 | $247,400 |
| 2024 | $3,060 | $414,600 | $187,300 | $227,300 |
| 2023 | $2,920 | $360,000 | $158,100 | $201,900 |
| 2022 | $2,775 | $302,300 | $141,500 | $160,800 |
| 2021 | $2,657 | $277,900 | $141,500 | $136,400 |
| 2020 | $2,610 | $261,000 | $139,300 | $121,700 |
| 2019 | $1,349 | $243,400 | $139,300 | $104,100 |
| 2018 | $2,420 | $235,200 | $131,100 | $104,100 |
| 2017 | $1,259 | $234,800 | $131,100 | $103,700 |
| 2016 | $2,343 | $234,800 | $131,100 | $103,700 |
| 2015 | $2,236 | $222,700 | $131,100 | $91,600 |
Source: Public Records
Map
Nearby Homes
- 8 Holly Ln
- 27 Wilfin Rd
- 9 Cedar St
- 4 Braddock St
- 31 Gardiner Ln
- 8 Rogers Ave
- 16 Peregrine Ln
- 26 Howes Rd
- 844 Route 28 Unit 1C
- 844 Route 28 Unit 1C
- 844 Route 28 Unit 9B
- 21 Lyndale Rd
- 745 Willow St
- 55 Aspinet Rd
- 109 Seaview Ave Unit 11
- 55 Pawkannawkut Dr
- 135 S Shore Dr Unit 17
- 135 S South Shore Dr Unit 17
- 7 Wood Rd
- 68 Bob-O-link Ln
- 100 Evergreen St
- 92 Evergreen St
- 0 Evergreen St
- 95 Evergreen St
- 99 Evergreen St
- 89 Evergreen St
- 106 Evergreen St
- 88 Evergreen St
- 103 Evergreen St
- 74 Pine Grove Rd
- 60 Braddock St
- 85 Evergreen St
- 61 Braddock St
- 76 Pine Grove Rd
- 66 Pine Grove Rd
- 61 Cedar St
- 110 Evergreen St
- 107 Evergreen St
- 80 Pine Grove Rd
- 82 Evergreen St