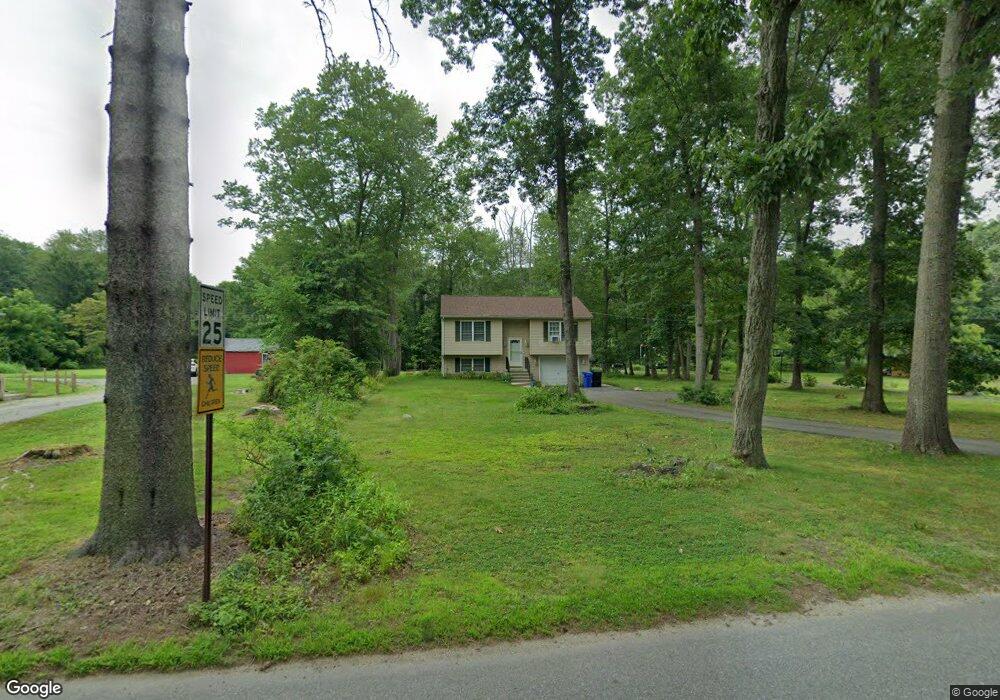
96 High St Moosup, CT 06354
Estimated Value: $292,000 - $332,000
2
Beds
1
Bath
870
Sq Ft
$357/Sq Ft
Est. Value
About This Home
This home is located at 96 High St, Moosup, CT 06354 and is currently estimated at $310,613, approximately $357 per square foot. 96 High St is a home located in Windham County with nearby schools including Plainfield Memorial School, Plainfield Central Middle School, and Plainfield High School.
Ownership History
Date
Name
Owned For
Owner Type
Purchase Details
Closed on
Dec 28, 2009
Sold by
Department Of Housing & Urban Dev
Bought by
Goslin Rebecca L
Current Estimated Value
Home Financials for this Owner
Home Financials are based on the most recent Mortgage that was taken out on this home.
Original Mortgage
$122,735
Interest Rate
4.92%
Mortgage Type
Purchase Money Mortgage
Purchase Details
Closed on
Oct 19, 2009
Sold by
Midfirst Bk
Bought by
Department Of Housing & Urban Dev
Purchase Details
Closed on
Sep 11, 2009
Sold by
Meyer Deborah A and Gliottone Cindy A
Bought by
Midfirst Bk
Purchase Details
Closed on
Mar 7, 2005
Sold by
Harrelle Robert J
Bought by
Meyer Deborah A and Gliottone Cindy A
Purchase Details
Closed on
Oct 17, 2002
Sold by
On Time Bldrs Llc
Bought by
Harrelle Robert J
Purchase Details
Closed on
May 14, 2002
Sold by
Walas Chester J
Bought by
On Time Bldrs Llc
Create a Home Valuation Report for This Property
The Home Valuation Report is an in-depth analysis detailing your home's value as well as a comparison with similar homes in the area
Home Values in the Area
Average Home Value in this Area
Purchase History
| Date | Buyer | Sale Price | Title Company |
|---|---|---|---|
| Goslin Rebecca L | $125,000 | -- | |
| Goslin Rebecca L | $125,000 | -- | |
| Department Of Housing & Urban Dev | -- | -- | |
| Department Of Housing & Urban Dev | -- | -- | |
| Midfirst Bk | -- | -- | |
| Midfirst Bk | -- | -- | |
| Meyer Deborah A | $173,000 | -- | |
| Meyer Deborah A | $173,000 | -- | |
| Harrelle Robert J | $137,000 | -- | |
| On Time Bldrs Llc | $16,500 | -- | |
| On Time Bldrs Llc | $16,500 | -- |
Source: Public Records
Mortgage History
| Date | Status | Borrower | Loan Amount |
|---|---|---|---|
| Open | On Time Bldrs Llc | $102,500 | |
| Closed | On Time Bldrs Llc | $122,735 |
Source: Public Records
Tax History Compared to Growth
Tax History
| Year | Tax Paid | Tax Assessment Tax Assessment Total Assessment is a certain percentage of the fair market value that is determined by local assessors to be the total taxable value of land and additions on the property. | Land | Improvement |
|---|---|---|---|---|
| 2025 | $3,501 | $148,270 | $28,160 | $120,110 |
| 2024 | $3,418 | $148,270 | $28,160 | $120,110 |
| 2023 | $3,401 | $148,270 | $28,160 | $120,110 |
| 2022 | $4,305 | $93,690 | $24,200 | $69,490 |
| 2021 | $2,879 | $93,690 | $24,200 | $69,490 |
| 2020 | $2,860 | $93,690 | $24,200 | $69,490 |
| 2019 | $2,860 | $93,690 | $24,200 | $69,490 |
| 2018 | $2,816 | $93,690 | $24,200 | $69,490 |
| 2017 | $2,918 | $91,120 | $24,200 | $66,920 |
| 2016 | $2,820 | $91,120 | $24,200 | $66,920 |
| 2015 | $2,748 | $91,120 | $24,200 | $66,920 |
| 2014 | $2,748 | $91,120 | $24,200 | $66,920 |
Source: Public Records
Map
Nearby Homes
- 50 High St
- 58 Milner Ave
- 100 Squaw Rock Rd
- 12 Walas Rd
- 92 Lake St
- 6 Jacques St
- 6 Grace Ln
- 279 Moosup Pond Rd
- 277 Moosup Pond Rd
- 8 Juniper Ln
- 29 Union St
- 6 Ward Ln
- 331 Pond Hill Rd
- 84 Brunswick Ave
- 60 Sterling Hill Rd
- 45 Main St Unit 202
- 0 Putnam Rd Unit 24117166
- 133 Sachem Dr
- 181 Snake Meadow Rd
- 47 Texas Heights Rd