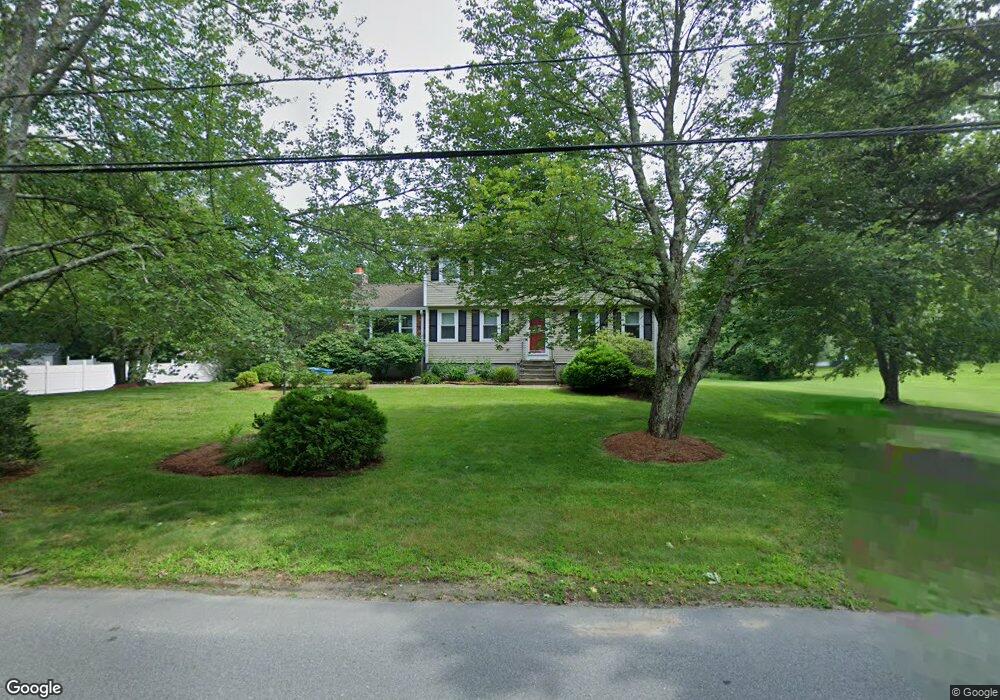
96 Maple St Methuen, MA 01844
The North End NeighborhoodEstimated Value: $736,000 - $807,000
3
Beds
3
Baths
2,761
Sq Ft
$277/Sq Ft
Est. Value
About This Home
This home is located at 96 Maple St, Methuen, MA 01844 and is currently estimated at $764,945, approximately $277 per square foot. 96 Maple St is a home located in Essex County with nearby schools including Methuen High School and The Birches Academy of Academics and Art.
Ownership History
Date
Name
Owned For
Owner Type
Purchase Details
Closed on
Apr 21, 2017
Sold by
Torra Joseph A and Torra Heather J
Bought by
Laferriere Joseph and Laferriere Megan
Current Estimated Value
Home Financials for this Owner
Home Financials are based on the most recent Mortgage that was taken out on this home.
Original Mortgage
$372,400
Outstanding Balance
$309,893
Interest Rate
4.21%
Mortgage Type
New Conventional
Estimated Equity
$455,052
Purchase Details
Closed on
Sep 7, 2004
Sold by
Lison Janice and Lison Peter
Bought by
Torra Heather J and Torra Joseph
Home Financials for this Owner
Home Financials are based on the most recent Mortgage that was taken out on this home.
Original Mortgage
$60,000
Interest Rate
6.01%
Mortgage Type
Purchase Money Mortgage
Create a Home Valuation Report for This Property
The Home Valuation Report is an in-depth analysis detailing your home's value as well as a comparison with similar homes in the area
Home Values in the Area
Average Home Value in this Area
Purchase History
| Date | Buyer | Sale Price | Title Company |
|---|---|---|---|
| Laferriere Joseph | $392,000 | -- | |
| Torra Heather J | $402,500 | -- |
Source: Public Records
Mortgage History
| Date | Status | Borrower | Loan Amount |
|---|---|---|---|
| Open | Laferriere Joseph | $372,400 | |
| Previous Owner | Torra Heather J | $60,000 |
Source: Public Records
Tax History
| Year | Tax Paid | Tax Assessment Tax Assessment Total Assessment is a certain percentage of the fair market value that is determined by local assessors to be the total taxable value of land and additions on the property. | Land | Improvement |
|---|---|---|---|---|
| 2025 | $6,684 | $631,800 | $306,600 | $325,200 |
| 2024 | $6,622 | $609,800 | $279,700 | $330,100 |
| 2023 | $6,362 | $543,800 | $248,600 | $295,200 |
| 2022 | $5,999 | $459,700 | $207,200 | $252,500 |
| 2021 | $5,657 | $428,900 | $196,900 | $232,000 |
| 2020 | $5,626 | $418,600 | $196,900 | $221,700 |
| 2019 | $5,433 | $382,900 | $176,200 | $206,700 |
| 2018 | $5,364 | $375,900 | $176,200 | $199,700 |
| 2017 | $5,248 | $358,200 | $176,200 | $182,000 |
| 2016 | $5,098 | $344,200 | $165,800 | $178,400 |
| 2015 | $4,922 | $337,100 | $165,800 | $171,300 |
Source: Public Records
Map
Nearby Homes
- 11 Brookside Ct
- 139 North St
- 55 Phoebe St Unit 32
- 7 Tree Top Way
- 40 Phoebe St Unit 101
- 159-161 Howe St
- 3 Adams Ave
- 127 Phoebe St Unit 127
- 125 Phoebe St Unit 125
- 47 Bailey Ct
- 28 Currier Ave
- 18 Shepard Ave
- 64-66 Howe St
- 20 Williams St
- 64 Pine Tree Dr Unit 64
- 2 Sequoia Dr Unit 2
- Lot 108 Garden City Rd
- 74 Ayers Village Rd
- 1513 Broadway
- 40 Stanwood Rd Unit 9
- 100 Maple St
- 34 Haymeadow Rd
- 141 Maple St
- 145 Maple St
- 55 Hampstead St
- 2 Haymeadow Rd
- 6 Haymeadow Rd
- 30 Haymeadow Rd
- 137 Maple St
- 47 Hampstead St
- 59 Hampstead St
- 45 Hampstead St
- 26 Haymeadow Rd
- 10 Haymeadow Rd
- 14 Haymeadow Rd
- 54 Hampstead St
- 56 Hampstead St
- 43 Hampstead St
- 110 Maple St
- 52 Hampstead St
Your Personal Tour Guide
Ask me questions while you tour the home.