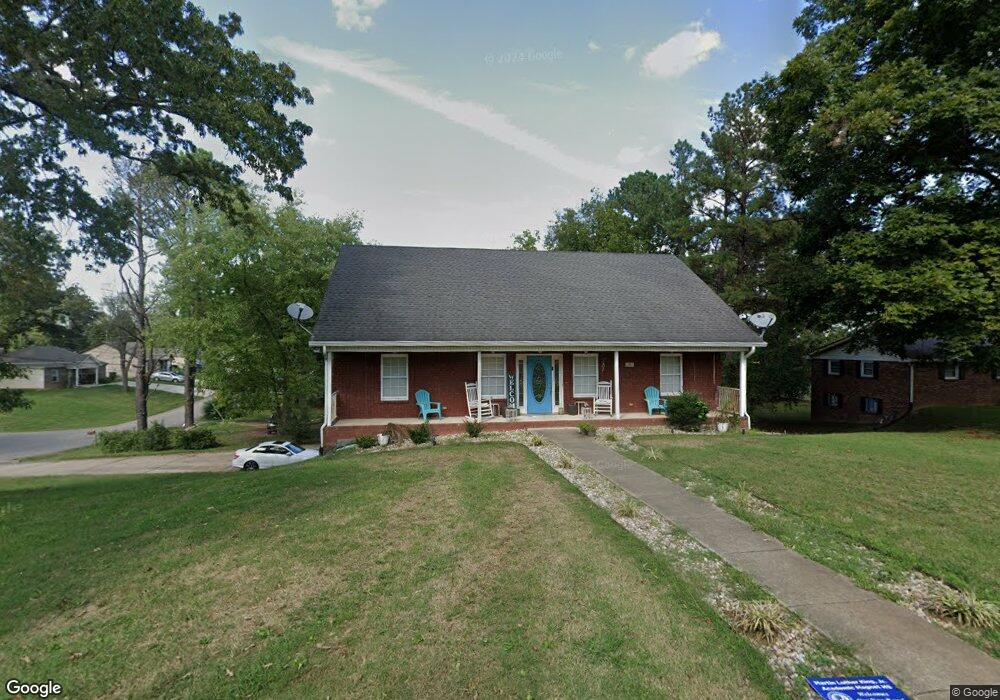
96 Mimosa Dr Springfield, TN 37172
Estimated Value: $308,000 - $409,000
Studio
3
Baths
2,291
Sq Ft
$159/Sq Ft
Est. Value
About This Home
This home is located at 96 Mimosa Dr, Springfield, TN 37172 and is currently estimated at $363,141, approximately $158 per square foot. 96 Mimosa Dr is a home located in Robertson County with nearby schools including Cheatham Park Elementary School, Westside Elementary School, and Innovation Academy.
Ownership History
Date
Name
Owned For
Owner Type
Purchase Details
Closed on
May 5, 2010
Sold by
Pearson Jessica N
Bought by
Hardin Gerlonda L
Current Estimated Value
Home Financials for this Owner
Home Financials are based on the most recent Mortgage that was taken out on this home.
Original Mortgage
$142,274
Outstanding Balance
$94,725
Interest Rate
5.15%
Estimated Equity
$268,416
Purchase Details
Closed on
Sep 26, 2007
Sold by
Worsham Jerry L
Bought by
John Pearson
Home Financials for this Owner
Home Financials are based on the most recent Mortgage that was taken out on this home.
Original Mortgage
$101,640
Interest Rate
6.41%
Purchase Details
Closed on
Jul 17, 2006
Sold by
Rayburn Rigsby
Bought by
Worsham Jerry L and Sweatt Pam
Purchase Details
Closed on
May 17, 2000
Sold by
Fox Russell S
Bought by
Rayburn Rigsby
Purchase Details
Closed on
Apr 22, 1999
Sold by
Hooper Lynn V
Bought by
Fox Russell S
Purchase Details
Closed on
Apr 22, 1987
Purchase Details
Closed on
Apr 2, 1970
Bought by
Villines Harry L
Create a Home Valuation Report for This Property
The Home Valuation Report is an in-depth analysis detailing your home's value as well as a comparison with similar homes in the area
Home Values in the Area
Average Home Value in this Area
Purchase History
| Date | Buyer | Sale Price | Title Company |
|---|---|---|---|
| Hardin Gerlonda L | $144,900 | -- | |
| John Pearson | $100,000 | -- | |
| Worsham Jerry L | $20,000 | -- | |
| Rayburn Rigsby | $19,000 | -- | |
| Fox Russell S | $75,500 | -- | |
| -- | -- | -- | |
| Villines Harry L | -- | -- |
Source: Public Records
Mortgage History
| Date | Status | Borrower | Loan Amount |
|---|---|---|---|
| Open | Villines Harry L | $142,274 | |
| Closed | Villines Harry L | $5,071 | |
| Previous Owner | Villines Harry L | $101,640 |
Source: Public Records
Tax History
| Year | Tax Paid | Tax Assessment Tax Assessment Total Assessment is a certain percentage of the fair market value that is determined by local assessors to be the total taxable value of land and additions on the property. | Land | Improvement |
|---|---|---|---|---|
| 2025 | -- | $92,250 | $11,250 | $81,000 |
| 2024 | -- | $92,250 | $11,250 | $81,000 |
| 2023 | $2,312 | $92,250 | $11,250 | $81,000 |
| 2022 | $2,203 | $60,400 | $2,750 | $57,650 |
| 2021 | $2,203 | $60,400 | $2,750 | $57,650 |
| 2020 | $2,203 | $60,400 | $2,750 | $57,650 |
| 2019 | $66,256 | $60,400 | $2,750 | $57,650 |
| 2018 | $2,203 | $60,400 | $2,750 | $57,650 |
| 2017 | $2,249 | $52,475 | $4,100 | $48,375 |
| 2016 | $2,249 | $52,475 | $4,100 | $48,375 |
| 2015 | $2,183 | $52,475 | $4,100 | $48,375 |
| 2014 | $2,183 | $52,475 | $4,100 | $48,375 |
Source: Public Records
Map
Nearby Homes
Your Personal Tour Guide
Ask me questions while you tour the home.