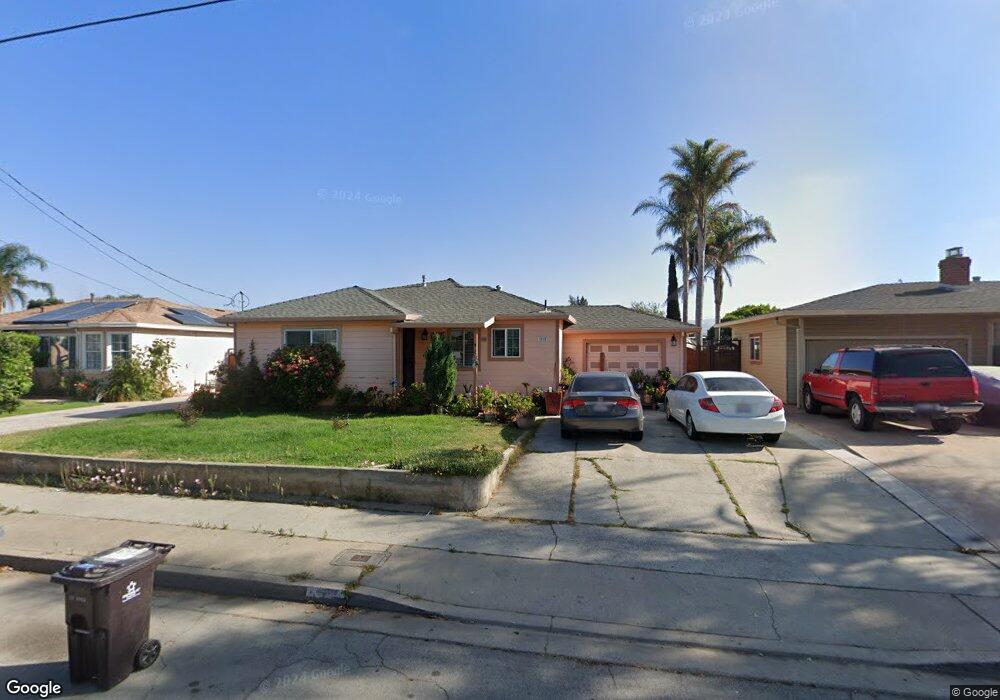
96 Oregon St Salinas, CA 93905
East Salinas NeighborhoodEstimated Value: $591,000 - $741,000
3
Beds
2
Baths
1,528
Sq Ft
$426/Sq Ft
Est. Value
About This Home
This home is located at 96 Oregon St, Salinas, CA 93905 and is currently estimated at $650,435, approximately $425 per square foot. 96 Oregon St is a home located in Monterey County with nearby schools including Fremont Elementary School, El Sausal Middle School, and Alisal High School.
Ownership History
Date
Name
Owned For
Owner Type
Purchase Details
Closed on
Jan 3, 2022
Sold by
Flores Cristina Rodriguez and Rodriguez Cristina
Bought by
Flores Cristina Rodriguez and Ramirez Guillermo Montano
Current Estimated Value
Purchase Details
Closed on
Apr 10, 2003
Sold by
Rodriguez Angelica
Bought by
Rodriguez Cristina
Home Financials for this Owner
Home Financials are based on the most recent Mortgage that was taken out on this home.
Original Mortgage
$150,000
Interest Rate
5.6%
Create a Home Valuation Report for This Property
The Home Valuation Report is an in-depth analysis detailing your home's value as well as a comparison with similar homes in the area
Home Values in the Area
Average Home Value in this Area
Purchase History
| Date | Buyer | Sale Price | Title Company |
|---|---|---|---|
| Flores Cristina Rodriguez | -- | Servicelink | |
| Rodriguez Cristina | -- | Old Republic Title |
Source: Public Records
Mortgage History
| Date | Status | Borrower | Loan Amount |
|---|---|---|---|
| Closed | Rodriguez Cristina | $150,000 |
Source: Public Records
Tax History
| Year | Tax Paid | Tax Assessment Tax Assessment Total Assessment is a certain percentage of the fair market value that is determined by local assessors to be the total taxable value of land and additions on the property. | Land | Improvement |
|---|---|---|---|---|
| 2025 | $3,176 | $247,186 | $112,684 | $134,502 |
| 2024 | $3,176 | $242,340 | $110,475 | $131,865 |
| 2023 | $3,116 | $237,589 | $108,309 | $129,280 |
| 2022 | $2,803 | $232,932 | $106,186 | $126,746 |
| 2021 | $2,802 | $228,365 | $104,104 | $124,261 |
| 2020 | $2,771 | $226,024 | $103,037 | $122,987 |
| 2019 | $2,856 | $221,593 | $101,017 | $120,576 |
| 2018 | $2,690 | $217,249 | $99,037 | $118,212 |
| 2017 | $2,791 | $212,991 | $97,096 | $115,895 |
| 2016 | $2,646 | $208,816 | $95,193 | $113,623 |
| 2015 | $2,622 | $205,681 | $93,764 | $111,917 |
| 2014 | $2,543 | $201,653 | $91,928 | $109,725 |
Source: Public Records
Map
Nearby Homes
- 11 Hill Cir
- 11 E Laurel Dr
- 933 Acosta Plaza Unit 35
- 320 N Sanborn Rd
- 544 Saint George Dr
- 609 Saint George Dr
- 948 Rider Ave
- 129 N Filice St
- 724 Circle Dr
- 1046 C St
- 78 Ragsdale Ct
- 230 Paloma Ave
- 755 Pino Way
- 150 Kern St Unit 114
- 150 Kern St Unit 40
- 487 E Market St
- 182 Kern St Unit 45
- 158 Kern St Unit 11
- 166 Kern St Unit 19
- 166 Kern St Unit 18
Your Personal Tour Guide
Ask me questions while you tour the home.