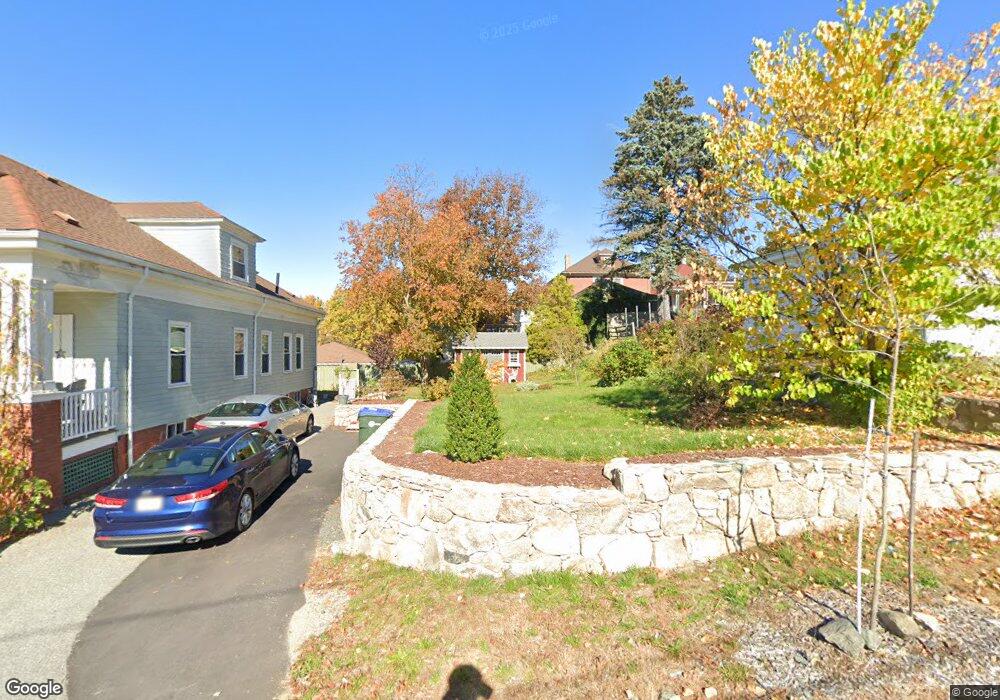
96 Raphael Ave Providence, RI 02904
Marieville NeighborhoodEstimated Value: $137,285 - $667,000
--
Bed
--
Bath
--
Sq Ft
3,920
Sq Ft Lot
About This Home
This home is located at 96 Raphael Ave, Providence, RI 02904 and is currently estimated at $333,321. 96 Raphael Ave is a home located in Providence County with nearby schools including Asa Messer Elementary School, Charles N. Fortes Elementary School, and Veazie Street Elementary School.
Ownership History
Date
Name
Owned For
Owner Type
Purchase Details
Closed on
Sep 11, 2019
Sold by
Wehbe Joumann
Bought by
Tsiongas K Nicholas and Tsiongas Nicholas
Current Estimated Value
Purchase Details
Closed on
Jun 16, 2005
Sold by
Tutor Richard
Bought by
Naddaf Joumna Hafiz
Purchase Details
Closed on
Feb 17, 2004
Sold by
Ercolano Elena
Bought by
Tutor Richard
Home Financials for this Owner
Home Financials are based on the most recent Mortgage that was taken out on this home.
Original Mortgage
$12,000
Interest Rate
5.82%
Mortgage Type
Purchase Money Mortgage
Create a Home Valuation Report for This Property
The Home Valuation Report is an in-depth analysis detailing your home's value as well as a comparison with similar homes in the area
Home Values in the Area
Average Home Value in this Area
Purchase History
| Date | Buyer | Sale Price | Title Company |
|---|---|---|---|
| Tsiongas K Nicholas | $80,000 | -- | |
| Naddaf Joumna Hafiz | $60,000 | -- | |
| Tutor Richard | $15,000 | -- |
Source: Public Records
Mortgage History
| Date | Status | Borrower | Loan Amount |
|---|---|---|---|
| Previous Owner | Tutor Richard | $12,000 |
Source: Public Records
Tax History Compared to Growth
Tax History
| Year | Tax Paid | Tax Assessment Tax Assessment Total Assessment is a certain percentage of the fair market value that is determined by local assessors to be the total taxable value of land and additions on the property. | Land | Improvement |
|---|---|---|---|---|
| 2025 | $1,869 | $128,000 | $128,000 | $0 |
| 2024 | $539 | $29,400 | $29,400 | $0 |
| 2023 | $539 | $29,400 | $29,400 | $0 |
| 2022 | $523 | $29,400 | $29,400 | $0 |
| 2021 | $526 | $21,400 | $21,400 | $0 |
| 2020 | $526 | $21,400 | $21,400 | $0 |
| 2019 | $526 | $21,400 | $21,400 | $0 |
| 2018 | $527 | $16,500 | $16,500 | $0 |
| 2017 | $527 | $16,500 | $16,500 | $0 |
| 2016 | $527 | $16,500 | $16,500 | $0 |
| 2015 | $553 | $16,700 | $16,700 | $0 |
| 2014 | $564 | $16,700 | $16,700 | $0 |
| 2013 | $564 | $16,700 | $16,700 | $0 |
Source: Public Records
Map
Nearby Homes