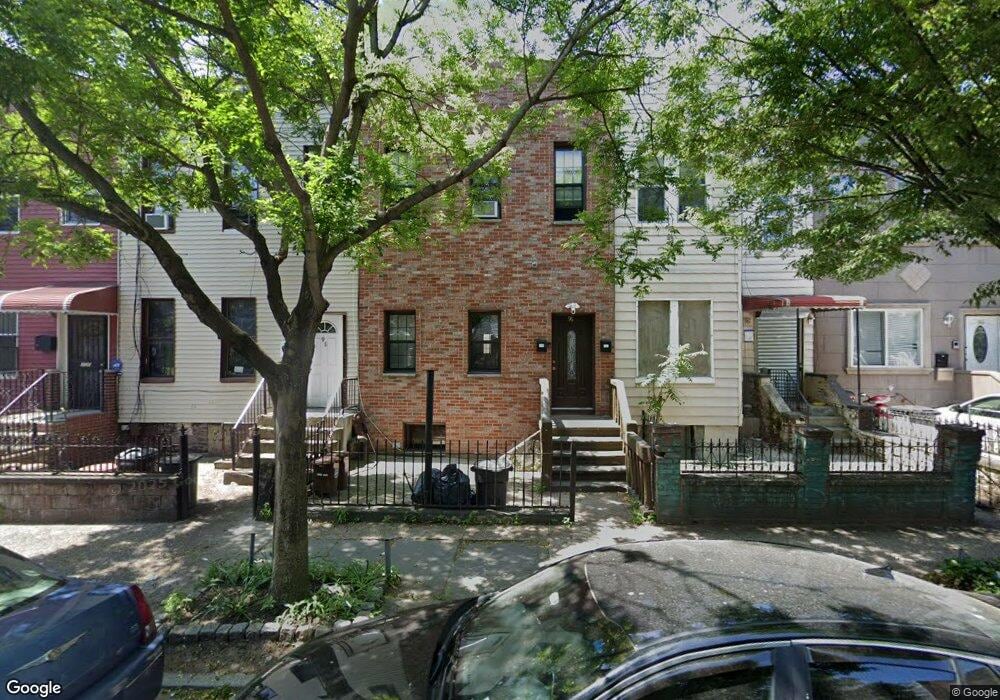
96 Sackman St Unit 1 Brooklyn, NY 11233
Ocean Hill NeighborhoodEstimated Value: $595,000 - $1,853,000
2
Beds
1
Bath
1,620
Sq Ft
$661/Sq Ft
Est. Value
About This Home
This home is located at 96 Sackman St Unit 1, Brooklyn, NY 11233 and is currently estimated at $1,070,920, approximately $661 per square foot. 96 Sackman St Unit 1 is a home located in Kings County with nearby schools including P.S. Is 155 Nicholas Herkimer, P.S. 178 Saint Clair Mckelway, and P.S./I.S. 137 Rachel Jean Mitchell.
Ownership History
Date
Name
Owned For
Owner Type
Purchase Details
Closed on
Mar 9, 2018
Sold by
Mcdermott Tresia and Taylor Ruthlyn
Bought by
Mcdermott Tresia
Current Estimated Value
Purchase Details
Closed on
Jun 23, 2014
Sold by
Shlomi Development Llc
Bought by
Mcdermott Tresia and Taylor Ruthlyn
Home Financials for this Owner
Home Financials are based on the most recent Mortgage that was taken out on this home.
Original Mortgage
$579,313
Interest Rate
4.19%
Mortgage Type
New Conventional
Purchase Details
Closed on
Dec 23, 2013
Sold by
Synergix Funding Group Llc
Bought by
Shlomi Development Llc
Purchase Details
Closed on
Dec 17, 2013
Sold by
Khan Ashfaqur Rahman
Bought by
Synergix Funding Group Llc
Purchase Details
Closed on
Feb 8, 2013
Sold by
Khan Ashfaqur Rahman
Bought by
Kitty Hawk Holdings Llc
Purchase Details
Closed on
May 26, 2009
Sold by
Sms Queens Holding Llc
Bought by
Khan Ashfaqur Rahman
Purchase Details
Closed on
Feb 25, 2009
Sold by
Liquidation Properties Inc
Bought by
Simcha Assets Corp
Purchase Details
Closed on
Jan 6, 2006
Sold by
Crooks Sandra
Bought by
Prescott Keith
Create a Home Valuation Report for This Property
The Home Valuation Report is an in-depth analysis detailing your home's value as well as a comparison with similar homes in the area
Home Values in the Area
Average Home Value in this Area
Purchase History
| Date | Buyer | Sale Price | Title Company |
|---|---|---|---|
| Mcdermott Tresia | -- | -- | |
| Mcdermott Tresia | -- | -- | |
| Mcdermott Tresia | -- | -- | |
| Mcdermott Tresia | -- | -- | |
| Mcdermott Tresia | $590,000 | -- | |
| Mcdermott Tresia | $590,000 | -- | |
| Mcdermott Tresia | $590,000 | -- | |
| Mcdermott Tresia | $590,000 | -- | |
| Mcdermott Tresia | $590,000 | -- | |
| Mcdermott Tresia | $590,000 | -- | |
| Shlomi Development Llc | $456,000 | -- | |
| Shlomi Development Llc | $456,000 | -- | |
| Shlomi Development Llc | $456,000 | -- | |
| Shlomi Development Llc | $456,000 | -- | |
| Shlomi Development Llc | $456,000 | -- | |
| Shlomi Development Llc | $456,000 | -- | |
| Synergix Funding Group Llc | $456,000 | -- | |
| Synergix Funding Group Llc | $456,000 | -- | |
| Synergix Funding Group Llc | $456,000 | -- | |
| Synergix Funding Group Llc | $456,000 | -- | |
| Synergix Funding Group Llc | $456,000 | -- | |
| Synergix Funding Group Llc | $456,000 | -- | |
| Kitty Hawk Holdings Llc | $500 | -- | |
| Kitty Hawk Holdings Llc | $500 | -- | |
| Kitty Hawk Holdings Llc | $500 | -- | |
| Kitty Hawk Holdings Llc | $500 | -- | |
| Kitty Hawk Holdings Llc | $500 | -- | |
| Kitty Hawk Holdings Llc | $500 | -- | |
| Khan Ashfaqur Rahman | $570,000 | -- | |
| Khan Ashfaqur Rahman | $570,000 | -- | |
| Khan Ashfaqur Rahman | $570,000 | -- | |
| Khan Ashfaqur Rahman | $570,000 | -- | |
| Khan Ashfaqur Rahman | $570,000 | -- | |
| Khan Ashfaqur Rahman | $570,000 | -- | |
| Simcha Assets Corp | $141,750 | -- | |
| Sms Queens Holding Llc | -- | -- | |
| Sms Queens Holding Llc | -- | -- | |
| Simcha Assets Corp | $141,750 | -- | |
| Simcha Assets Corp | $141,750 | -- | |
| Simcha Assets Corp | $141,750 | -- | |
| Sms Queens Holding Llc | -- | -- | |
| Sms Queens Holding Llc | -- | -- | |
| Simcha Assets Corp | $141,750 | -- | |
| Simcha Assets Corp | $141,750 | -- | |
| Prescott Keith | $495,000 | -- | |
| Prescott Keith | $495,000 | -- | |
| Prescott Keith | $495,000 | -- | |
| Prescott Keith | $495,000 | -- | |
| Prescott Keith | $495,000 | -- | |
| Prescott Keith | $495,000 | -- |
Source: Public Records
Mortgage History
| Date | Status | Borrower | Loan Amount |
|---|---|---|---|
| Previous Owner | Mcdermott Tresia | $579,313 |
Source: Public Records
Tax History
| Year | Tax Paid | Tax Assessment Tax Assessment Total Assessment is a certain percentage of the fair market value that is determined by local assessors to be the total taxable value of land and additions on the property. | Land | Improvement |
|---|---|---|---|---|
| 2025 | $4,050 | $53,880 | $15,120 | $38,760 |
| 2024 | $4,050 | $53,760 | $15,120 | $38,640 |
| 2023 | $3,863 | $65,940 | $15,120 | $50,820 |
| 2022 | $3,582 | $52,740 | $15,120 | $37,620 |
| 2021 | $3,776 | $44,940 | $15,120 | $29,820 |
| 2020 | $1,868 | $54,480 | $15,120 | $39,360 |
| 2019 | $3,699 | $60,240 | $15,120 | $45,120 |
| 2018 | $3,568 | $17,503 | $4,575 | $12,928 |
| 2017 | $633 | $3,103 | $1,406 | $1,697 |
| 2016 | $620 | $3,103 | $1,369 | $1,734 |
| 2015 | $353 | $3,033 | $1,745 | $1,288 |
| 2014 | $353 | $2,884 | $1,993 | $891 |
Source: Public Records
Map
Nearby Homes
- 90 Sackman St
- 27 Sherlock Place
- 2347 Pacific St
- 2358 Pacific St
- 27 Monaco Place
- 1350 Herkimer St
- 2446 Dean St
- 10 Monaco Place
- 148 Somers St
- 2349 Dean St
- 65 Mother Gaston Blvd
- 70 Somers St
- 2337 Dean St
- 2267 Pacific St
- 210 Hull St Unit 210A
- 210 Hull St Unit A
- 2226 Pacific St
- 91 Somers St
- 2342 Dean St
- 1777 Eastern Pkwy
- 94 Sackman St
- 94 Sackman St
- 96 Sackman St
- 92 Sackman St
- 92 Sackman St Unit 2
- 92 Sackman St Unit 1
- 98 Sackman St
- 98 Sackman St Unit Building
- 88 Sackman St
- 100 Sackman St
- 2371 Atlantic Ave
- 102 Sackman St
- 86 Sackman St
- 84 Sackman St
- 2365 Atlantic Ave
- 82 Sackman St
- 93A Sackman St
- 19 Sherlock Place
- 17 Sherlock Place
- 95A Sackman St
Your Personal Tour Guide
Ask me questions while you tour the home.