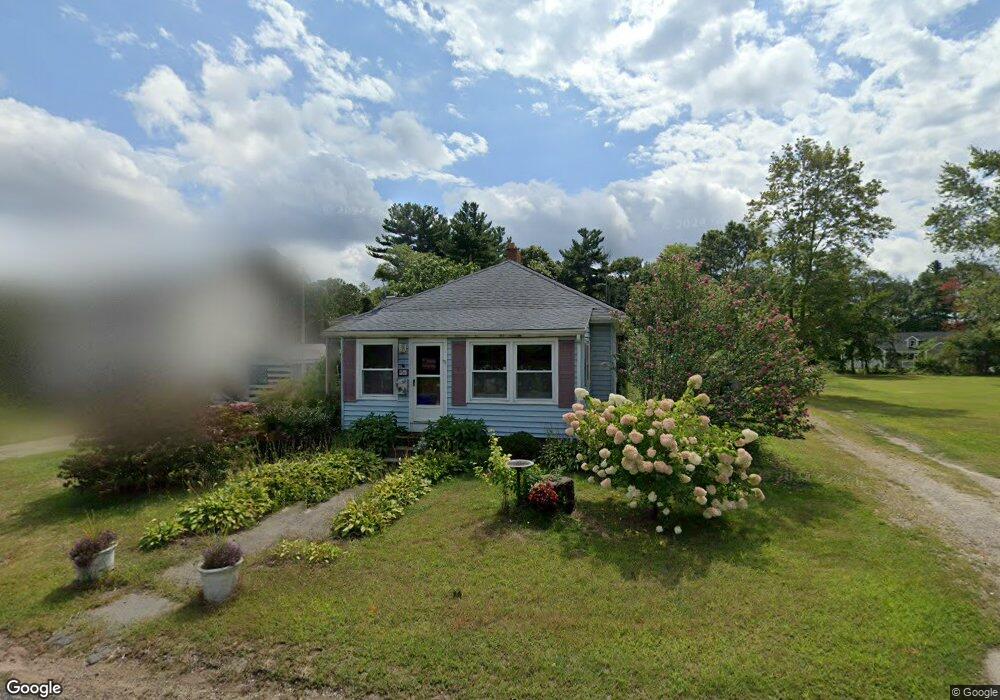
96 Salem St Rockland, MA 02370
Estimated Value: $420,000 - $476,898
2
Beds
1
Bath
924
Sq Ft
$490/Sq Ft
Est. Value
About This Home
This home is located at 96 Salem St, Rockland, MA 02370 and is currently estimated at $452,475, approximately $489 per square foot. 96 Salem St is a home located in Plymouth County with nearby schools including Rockland Senior High School, Calvary Chapel Academy, and Holy Family Elementary School.
Ownership History
Date
Name
Owned For
Owner Type
Purchase Details
Closed on
Apr 11, 2022
Sold by
Reynolds Brian P and Reynolds Barbara A
Bought by
96 Salem St Rt
Current Estimated Value
Purchase Details
Closed on
Oct 28, 1988
Sold by
Dunn Michael A
Bought by
Reynolds Brian P
Home Financials for this Owner
Home Financials are based on the most recent Mortgage that was taken out on this home.
Original Mortgage
$101,600
Interest Rate
10.32%
Mortgage Type
Purchase Money Mortgage
Create a Home Valuation Report for This Property
The Home Valuation Report is an in-depth analysis detailing your home's value as well as a comparison with similar homes in the area
Home Values in the Area
Average Home Value in this Area
Purchase History
| Date | Buyer | Sale Price | Title Company |
|---|---|---|---|
| 96 Salem St Rt | -- | None Available | |
| Reynolds Brian P | $112,900 | -- |
Source: Public Records
Mortgage History
| Date | Status | Borrower | Loan Amount |
|---|---|---|---|
| Previous Owner | Reynolds Brian P | $95,000 | |
| Previous Owner | Reynolds Brian P | $101,600 |
Source: Public Records
Tax History Compared to Growth
Tax History
| Year | Tax Paid | Tax Assessment Tax Assessment Total Assessment is a certain percentage of the fair market value that is determined by local assessors to be the total taxable value of land and additions on the property. | Land | Improvement |
|---|---|---|---|---|
| 2025 | $5,896 | $431,300 | $225,000 | $206,300 |
| 2024 | $5,722 | $407,000 | $212,200 | $194,800 |
| 2023 | $5,540 | $364,000 | $184,400 | $179,600 |
| 2022 | $5,300 | $316,400 | $160,300 | $156,100 |
| 2021 | $4,811 | $278,400 | $145,800 | $132,600 |
| 2020 | $4,641 | $265,200 | $138,800 | $126,400 |
| 2019 | $8,130 | $253,000 | $132,200 | $120,800 |
| 2018 | $4,280 | $234,900 | $132,200 | $102,700 |
| 2017 | $4,175 | $225,900 | $132,200 | $93,700 |
| 2016 | $4,020 | $217,400 | $127,200 | $90,200 |
| 2015 | $4,076 | $214,200 | $132,100 | $82,100 |
| 2014 | $3,853 | $210,100 | $129,500 | $80,600 |
Source: Public Records
Map
Nearby Homes
- 10 Horn Beam St Unit 299
- 94 Leisurewoods Dr
- 35-37 Salem St
- 86 Leisurewoods Dr Unit 279
- 5 Juniper Cir
- 11 Hawthorne St
- 9 Juniper Cir
- 3 Hickory Cir
- 737-739 Union St
- 775 Union St
- 12 Dyer St Unit 12
- 14 Dyer St Unit 14
- 83 Summit St
- 11 Dyer St Unit 11
- 13 Dyer St Unit 13
- 27 Fir Rd
- 40 Fir Rd Unit 386
- 1 Canterbury Ln
- 6 Chestnut Cir
- 20 Birch St