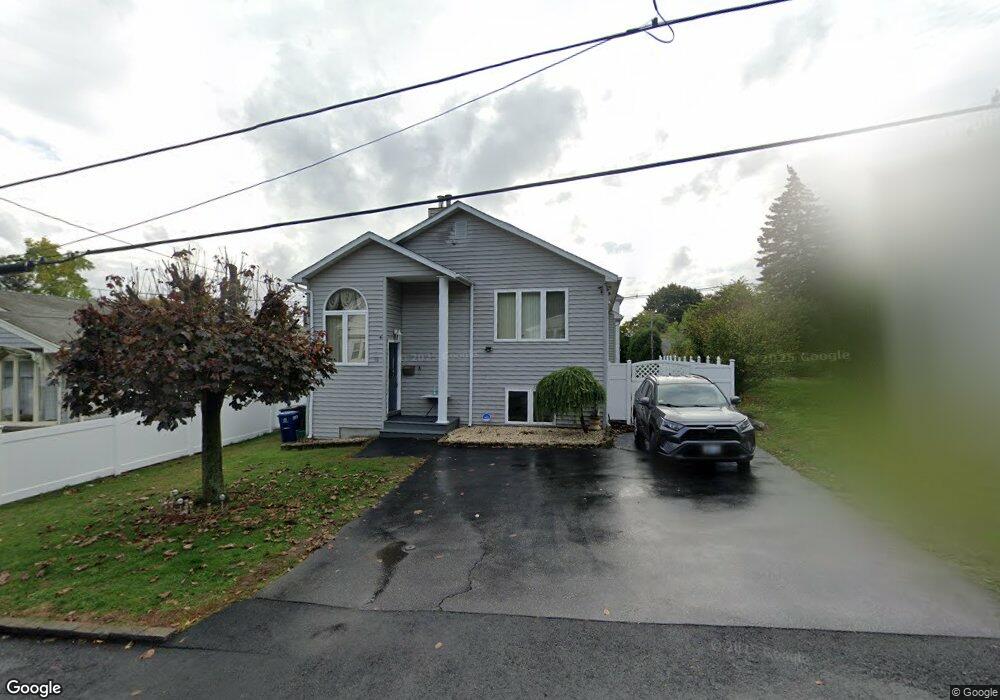
96 Walnut St Johnston, RI 02919
Thornton NeighborhoodEstimated Value: $502,759 - $628,000
4
Beds
3
Baths
2,624
Sq Ft
$210/Sq Ft
Est. Value
About This Home
This home is located at 96 Walnut St, Johnston, RI 02919 and is currently estimated at $551,190, approximately $210 per square foot. 96 Walnut St is a home located in Providence County with nearby schools including Johnston Senior High School, Achievement First Promesa, and St Rocco School.
Ownership History
Date
Name
Owned For
Owner Type
Purchase Details
Closed on
Jan 12, 2024
Sold by
Villagran Hector O and Villagran-Sigui Evelyn S
Bought by
Villagran Hector O and Villagran-Sigui
Current Estimated Value
Purchase Details
Closed on
Oct 24, 2023
Sold by
Villagran Hector O
Bought by
Vilagran Hector O and Villagran-Sigui Evelyn S
Purchase Details
Closed on
Oct 15, 2009
Sold by
Macera Anthony J and Macera Karen E
Bought by
Vilagran Hector O
Create a Home Valuation Report for This Property
The Home Valuation Report is an in-depth analysis detailing your home's value as well as a comparison with similar homes in the area
Home Values in the Area
Average Home Value in this Area
Purchase History
| Date | Buyer | Sale Price | Title Company |
|---|---|---|---|
| Villagran Hector O | -- | None Available | |
| Hector O Villagran Irt | -- | None Available | |
| Villagran Hector O | -- | None Available | |
| Vilagran Hector O | -- | None Available | |
| Vilagran Hector O | -- | None Available | |
| Vilagran Hector O | $235,000 | -- | |
| Vilagran Hector O | $235,000 | -- |
Source: Public Records
Mortgage History
| Date | Status | Borrower | Loan Amount |
|---|---|---|---|
| Previous Owner | Vilagran Hector O | $65,545 | |
| Previous Owner | Vilagran Hector O | $226,631 |
Source: Public Records
Tax History
| Year | Tax Paid | Tax Assessment Tax Assessment Total Assessment is a certain percentage of the fair market value that is determined by local assessors to be the total taxable value of land and additions on the property. | Land | Improvement |
|---|---|---|---|---|
| 2025 | $6,200 | $396,900 | $74,800 | $322,100 |
| 2024 | $6,073 | $396,900 | $74,800 | $322,100 |
| 2023 | $6,073 | $396,900 | $74,800 | $322,100 |
| 2022 | $4,501 | $242,100 | $53,100 | $189,000 |
| 2021 | $5,626 | $242,100 | $53,100 | $189,000 |
| 2018 | $5,974 | $217,300 | $45,700 | $171,600 |
| 2016 | $7,903 | $217,300 | $45,700 | $171,600 |
| 2015 | $5,549 | $191,400 | $41,600 | $149,800 |
| 2014 | $4,402 | $191,400 | $41,600 | $149,800 |
| 2013 | $5,503 | $191,400 | $41,600 | $149,800 |
Source: Public Records
Map
Nearby Homes
Your Personal Tour Guide
Ask me questions while you tour the home.