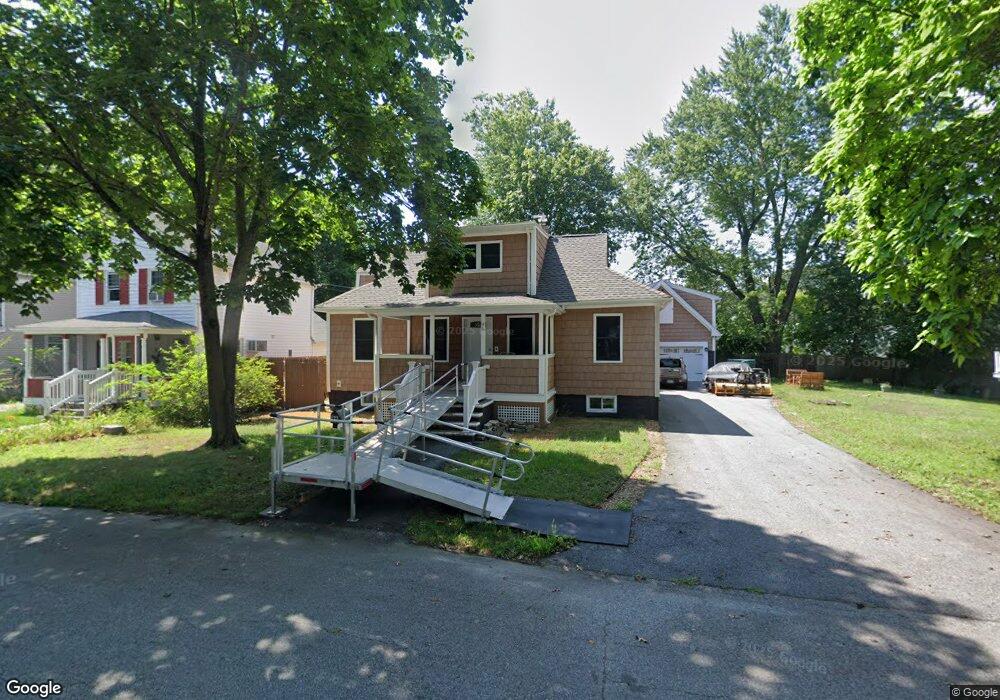
96 Wilson Ave Warwick, RI 02889
Oakland Beach NeighborhoodEstimated Value: $328,000 - $444,000
2
Beds
2
Baths
1,481
Sq Ft
$261/Sq Ft
Est. Value
About This Home
This home is located at 96 Wilson Ave, Warwick, RI 02889 and is currently estimated at $387,261, approximately $261 per square foot. 96 Wilson Ave is a home located in Kent County with nearby schools including Saint Kevin School and Bishop Hendricken High School.
Ownership History
Date
Name
Owned For
Owner Type
Purchase Details
Closed on
Sep 23, 2010
Sold by
Montgomery and Montgomery Burns
Bought by
Craelen Prop
Current Estimated Value
Purchase Details
Closed on
Jun 21, 2010
Sold by
Nationstar Mtg
Bought by
Montgomery & Burns Llc
Home Financials for this Owner
Home Financials are based on the most recent Mortgage that was taken out on this home.
Original Mortgage
$45,000
Interest Rate
5.03%
Mortgage Type
Purchase Money Mortgage
Purchase Details
Closed on
May 28, 2010
Sold by
Ri Center Home Equity and Nationstar Mortgage Ll
Bought by
Nationstar Mortgage Ll
Home Financials for this Owner
Home Financials are based on the most recent Mortgage that was taken out on this home.
Original Mortgage
$45,000
Interest Rate
5.03%
Mortgage Type
Purchase Money Mortgage
Purchase Details
Closed on
Oct 29, 2008
Sold by
Colvin Claudia J and Nationstart Mortgage
Bought by
Ri Centex Home Equity
Purchase Details
Closed on
May 30, 1990
Sold by
Boyajian Tr John
Bought by
Jackson Stephen R
Create a Home Valuation Report for This Property
The Home Valuation Report is an in-depth analysis detailing your home's value as well as a comparison with similar homes in the area
Home Values in the Area
Average Home Value in this Area
Purchase History
| Date | Buyer | Sale Price | Title Company |
|---|---|---|---|
| Craelen Prop | $66,000 | -- | |
| Montgomery & Burns Llc | $45,000 | -- | |
| Nationstar Mortgage Ll | $26,000 | -- | |
| Ri Centex Home Equity | $101,150 | -- | |
| Jackson Stephen R | $80,500 | -- | |
| Jackson Stephen R | $80,500 | -- |
Source: Public Records
Mortgage History
| Date | Status | Borrower | Loan Amount |
|---|---|---|---|
| Previous Owner | Jackson Stephen R | $45,000 | |
| Previous Owner | Jackson Stephen R | $100,800 | |
| Previous Owner | Jackson Stephen R | $97,750 |
Source: Public Records
Tax History Compared to Growth
Tax History
| Year | Tax Paid | Tax Assessment Tax Assessment Total Assessment is a certain percentage of the fair market value that is determined by local assessors to be the total taxable value of land and additions on the property. | Land | Improvement |
|---|---|---|---|---|
| 2025 | $4,972 | $391,500 | $101,200 | $290,300 |
| 2024 | $4,568 | $315,700 | $83,600 | $232,100 |
| 2023 | $4,480 | $315,700 | $83,600 | $232,100 |
| 2022 | $4,254 | $227,100 | $47,000 | $180,100 |
| 2021 | $4,254 | $227,100 | $47,000 | $180,100 |
| 2020 | $4,254 | $227,100 | $47,000 | $180,100 |
| 2019 | $4,254 | $227,100 | $47,000 | $180,100 |
| 2018 | $3,405 | $163,700 | $47,000 | $116,700 |
| 2017 | $3,313 | $163,700 | $47,000 | $116,700 |
| 2016 | $3,291 | $162,600 | $47,000 | $115,600 |
| 2015 | $3,455 | $166,500 | $58,000 | $108,500 |
| 2014 | $3,340 | $166,500 | $58,000 | $108,500 |
| 2013 | $2,741 | $138,500 | $58,000 | $80,500 |
Source: Public Records
Map
Nearby Homes