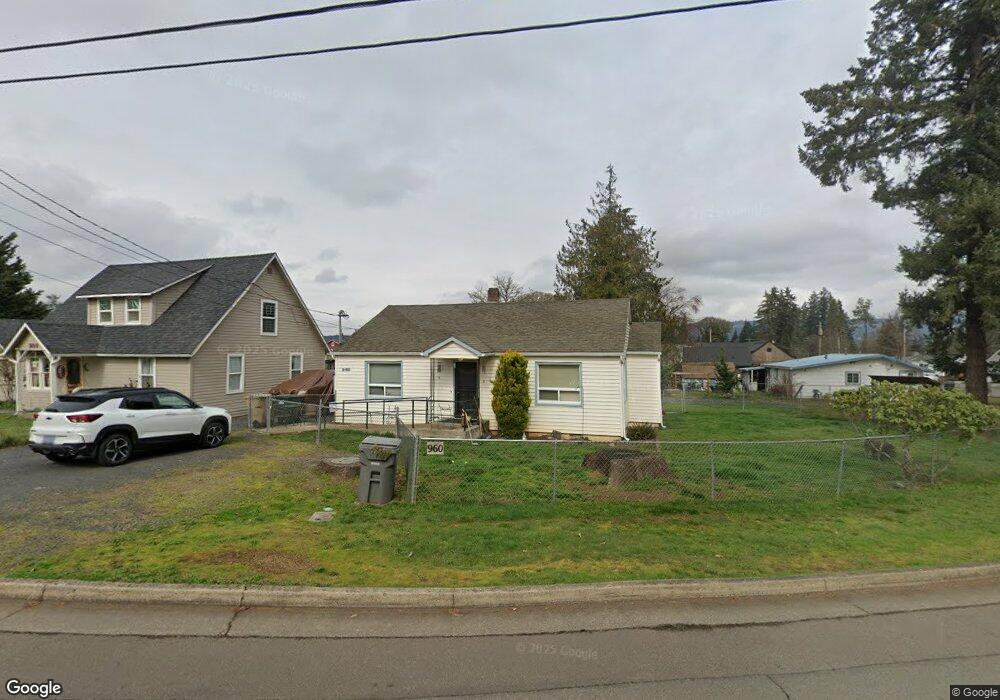
960 Alder St Unit A Sweet Home, OR 97386
Estimated Value: $335,000 - $342,276
1
Bed
1
Bath
528
Sq Ft
$641/Sq Ft
Est. Value
About This Home
This home is located at 960 Alder St Unit A, Sweet Home, OR 97386 and is currently estimated at $338,638, approximately $641 per square foot. 960 Alder St Unit A is a home located in Linn County with nearby schools including Sweet Home High School, Sweet Home Charter School, and Little Promises Children's Program.
Ownership History
Date
Name
Owned For
Owner Type
Purchase Details
Closed on
Nov 20, 2015
Sold by
Henthorne Sue G and Skinner Sue Gray
Bought by
Skinner Robert L
Current Estimated Value
Purchase Details
Closed on
Jan 15, 2007
Sold by
Mcneer Virginia M
Bought by
Henthorne Sue G
Home Financials for this Owner
Home Financials are based on the most recent Mortgage that was taken out on this home.
Original Mortgage
$83,200
Outstanding Balance
$49,387
Interest Rate
6.09%
Mortgage Type
Purchase Money Mortgage
Estimated Equity
$289,251
Create a Home Valuation Report for This Property
The Home Valuation Report is an in-depth analysis detailing your home's value as well as a comparison with similar homes in the area
Home Values in the Area
Average Home Value in this Area
Purchase History
| Date | Buyer | Sale Price | Title Company |
|---|---|---|---|
| Skinner Robert L | -- | None Available | |
| Henthorne Sue G | $104,000 | Lawyers Title Insurance Corp |
Source: Public Records
Mortgage History
| Date | Status | Borrower | Loan Amount |
|---|---|---|---|
| Open | Henthorne Sue G | $83,200 |
Source: Public Records
Tax History Compared to Growth
Tax History
| Year | Tax Paid | Tax Assessment Tax Assessment Total Assessment is a certain percentage of the fair market value that is determined by local assessors to be the total taxable value of land and additions on the property. | Land | Improvement |
|---|---|---|---|---|
| 2024 | $2,726 | $140,800 | -- | -- |
| 2023 | $2,441 | $136,700 | $0 | $0 |
| 2022 | $2,390 | $132,720 | $0 | $0 |
| 2021 | $2,459 | $128,860 | $0 | $0 |
| 2020 | $2,402 | $125,110 | $0 | $0 |
| 2019 | $2,344 | $121,470 | $0 | $0 |
| 2018 | $2,280 | $117,940 | $0 | $0 |
| 2017 | $2,192 | $114,510 | $0 | $0 |
| 2016 | $2,005 | $111,180 | $0 | $0 |
| 2015 | $2,063 | $107,950 | $0 | $0 |
| 2014 | $1,916 | $104,810 | $0 | $0 |
Source: Public Records
Map
Nearby Homes