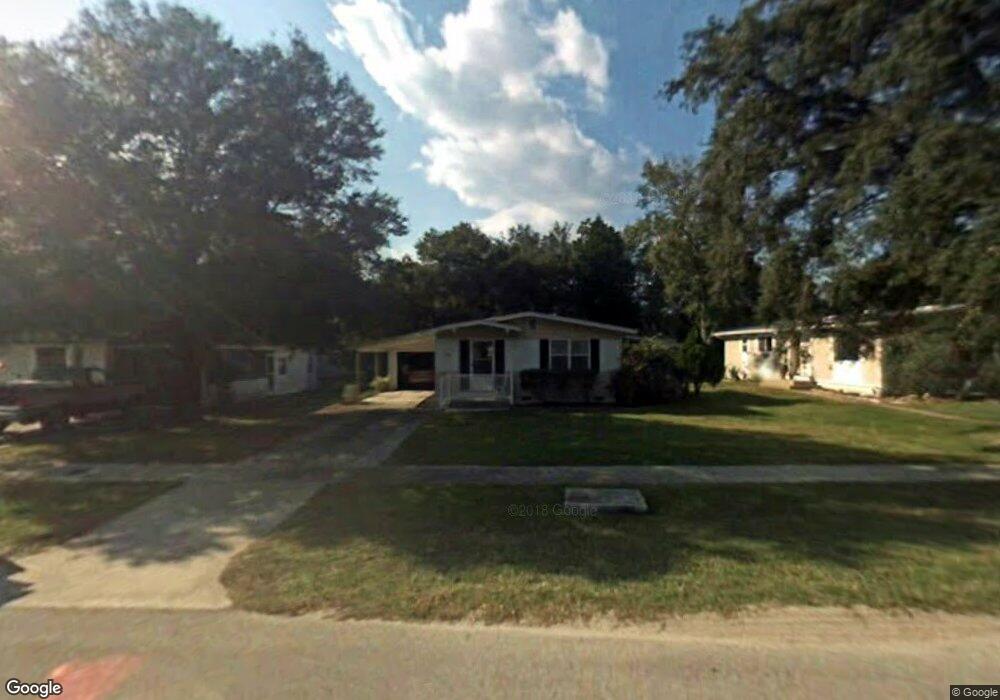
960 Aragon Ave Unit 35 Saint Augustine, FL 32086
Estimated Value: $302,000 - $315,000
3
Beds
2
Baths
1,236
Sq Ft
$249/Sq Ft
Est. Value
About This Home
This home is located at 960 Aragon Ave Unit 35, Saint Augustine, FL 32086 and is currently estimated at $308,279, approximately $249 per square foot. 960 Aragon Ave Unit 35 is a home located in St. Johns County with nearby schools including W. Douglas Hartley Elementary School, Gamble Rogers Middle School, and Pedro Menendez High School.
Ownership History
Date
Name
Owned For
Owner Type
Purchase Details
Closed on
Feb 4, 2021
Sold by
Scott Pura Nyoka and Hammond David Joseph
Bought by
Carter Chista Anne and Sloop Christopher Wayne
Current Estimated Value
Home Financials for this Owner
Home Financials are based on the most recent Mortgage that was taken out on this home.
Original Mortgage
$220,433
Outstanding Balance
$196,811
Interest Rate
2.6%
Mortgage Type
FHA
Estimated Equity
$111,468
Purchase Details
Closed on
Mar 28, 2016
Sold by
King Linda
Bought by
Scott Pura Myoka and Hammond David Joseph
Home Financials for this Owner
Home Financials are based on the most recent Mortgage that was taken out on this home.
Original Mortgage
$141,391
Interest Rate
3.75%
Mortgage Type
FHA
Purchase Details
Closed on
Feb 7, 2011
Sold by
King Linda and Brady Trust
Bought by
King Linda
Create a Home Valuation Report for This Property
The Home Valuation Report is an in-depth analysis detailing your home's value as well as a comparison with similar homes in the area
Home Values in the Area
Average Home Value in this Area
Purchase History
| Date | Buyer | Sale Price | Title Company |
|---|---|---|---|
| Carter Chista Anne | $224,500 | Action Ttl Svcs Of St Johns | |
| Scott Pura Myoka | $144,000 | Action Title Services Of St | |
| King Linda | $76,000 | Attorney | |
| King Linda | -- | Attorney |
Source: Public Records
Mortgage History
| Date | Status | Borrower | Loan Amount |
|---|---|---|---|
| Open | Carter Chista Anne | $220,433 | |
| Previous Owner | Scott Pura Myoka | $141,391 |
Source: Public Records
Tax History Compared to Growth
Tax History
| Year | Tax Paid | Tax Assessment Tax Assessment Total Assessment is a certain percentage of the fair market value that is determined by local assessors to be the total taxable value of land and additions on the property. | Land | Improvement |
|---|---|---|---|---|
| 2025 | $2,846 | $258,114 | -- | -- |
| 2024 | $2,846 | $250,840 | -- | -- |
| 2023 | $2,846 | $243,534 | $0 | $0 |
| 2022 | $2,759 | $236,441 | $42,806 | $193,635 |
| 2021 | $1,390 | $127,098 | $0 | $0 |
| 2020 | $1,382 | $125,343 | $0 | $0 |
| 2019 | $1,396 | $122,525 | $0 | $0 |
| 2018 | $1,371 | $120,240 | $0 | $0 |
| 2017 | $1,415 | $121,476 | $26,460 | $95,016 |
| 2016 | $673 | $110,533 | $0 | $0 |
| 2015 | $683 | $64,499 | $0 | $0 |
| 2014 | $685 | $63,987 | $0 | $0 |
Source: Public Records
Map
Nearby Homes
- 906 Palermo Rd
- 65 Deltona Blvd
- 59 Deltona Blvd
- 894 Palermo Rd
- 56 Deltona Blvd
- 196 Phoenetia Dr
- 93 Shores Blvd
- 163 Phoenetia Dr
- 209 Laguna Ct
- 133 Andora St
- 200 Raintree Trail
- 187 Deltona Blvd
- 1017 Ridgewood Ln
- 300 Raintree Trail
- 0 Shores Blvd Unit 255994
- 1108 Windwood Ct
- 258 Costado St
- 1041 Ridgewood Ln
- 984 Ridgewood Ln
- 214 Raintree Trail