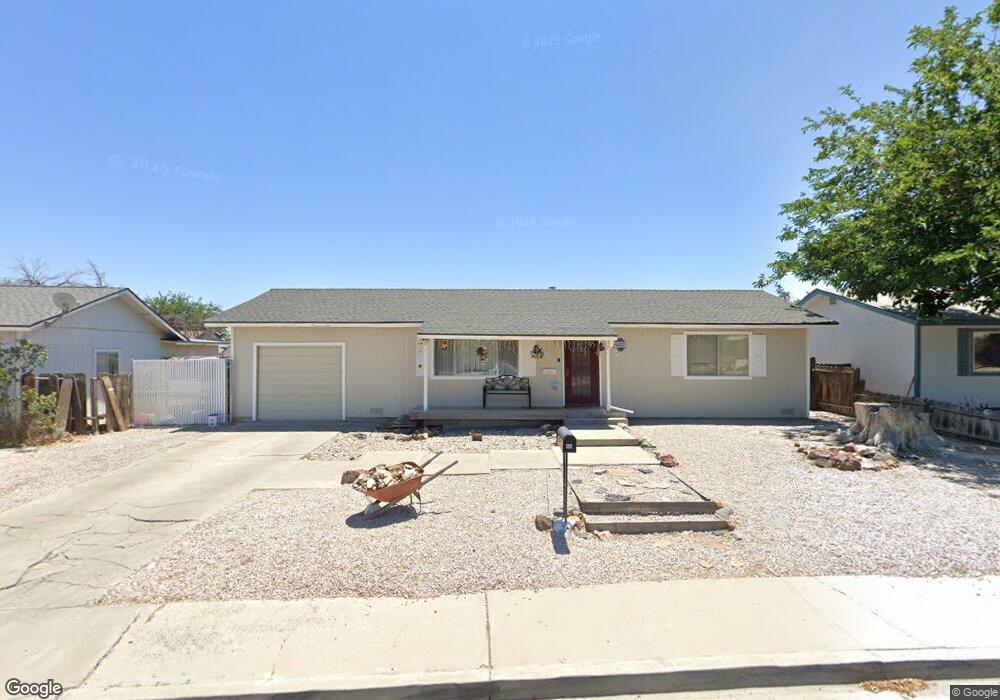
960 Concord Ave Fallon, NV 89406
Estimated Value: $286,000 - $337,197
4
Beds
2
Baths
1,280
Sq Ft
$239/Sq Ft
Est. Value
About This Home
This home is located at 960 Concord Ave, Fallon, NV 89406 and is currently estimated at $305,549, approximately $238 per square foot. 960 Concord Ave is a home located in Churchill County with nearby schools including Lahontan Elementary School, E.C. Best Elementary School, and Numa Elementary School.
Ownership History
Date
Name
Owned For
Owner Type
Purchase Details
Closed on
Nov 21, 2011
Sold by
The Bank Of New York Mellon
Bought by
C & A Rentals Llc
Current Estimated Value
Purchase Details
Closed on
May 18, 2011
Sold by
Barnett William and Barnett Nona
Bought by
The Bank Of New York Mellon
Purchase Details
Closed on
Apr 11, 2011
Sold by
Recontrust Company N A
Bought by
Barnett William and Barnett Nona
Purchase Details
Closed on
Mar 19, 2011
Sold by
Barnett William and Barnett Nona
Bought by
The Bank Of New York Mellon and The Bank Of New York
Purchase Details
Closed on
Feb 8, 2006
Sold by
Thompson Jason J and Thompson Judy
Bought by
Barnett William and Barnett Nona
Home Financials for this Owner
Home Financials are based on the most recent Mortgage that was taken out on this home.
Original Mortgage
$146,400
Interest Rate
8.12%
Purchase Details
Closed on
Nov 28, 2005
Sold by
Mccoy Delmar E and Mccoy Hazel M
Bought by
Thompson Jason J and Thompson Judy
Create a Home Valuation Report for This Property
The Home Valuation Report is an in-depth analysis detailing your home's value as well as a comparison with similar homes in the area
Home Values in the Area
Average Home Value in this Area
Purchase History
| Date | Buyer | Sale Price | Title Company |
|---|---|---|---|
| C & A Rentals Llc | $48,000 | First American Title Ins | |
| The Bank Of New York Mellon | $45,000 | First American | |
| Barnett William | $53,100 | First American Title Nationa | |
| The Bank Of New York Mellon | $53,100 | First American Title Company | |
| Barnett William | $183,000 | Stewart Title Company | |
| Thompson Jason J | $162,000 | Stewart Title Company |
Source: Public Records
Mortgage History
| Date | Status | Borrower | Loan Amount |
|---|---|---|---|
| Previous Owner | Barnett William | $146,400 |
Source: Public Records
Tax History
| Year | Tax Paid | Tax Assessment Tax Assessment Total Assessment is a certain percentage of the fair market value that is determined by local assessors to be the total taxable value of land and additions on the property. | Land | Improvement |
|---|---|---|---|---|
| 2025 | $1,161 | $35,274 | $13,650 | $21,624 |
| 2024 | $1,161 | $35,295 | $12,950 | $22,345 |
| 2023 | $1,161 | $33,642 | $12,250 | $21,392 |
| 2022 | $996 | $26,971 | $8,050 | $18,921 |
| 2021 | $970 | $26,280 | $8,050 | $18,230 |
| 2020 | $995 | $27,014 | $8,050 | $18,964 |
| 2019 | $983 | $26,911 | $8,050 | $18,861 |
| 2018 | $938 | $26,748 | $8,050 | $18,698 |
| 2017 | $900 | $25,510 | $6,475 | $19,035 |
| 2016 | $878 | $24,492 | $6,475 | $18,017 |
| 2015 | $861 | $22,648 | $6,475 | $16,173 |
| 2014 | $834 | $22,032 | $7,000 | $15,032 |
Source: Public Records
Map
Nearby Homes
- 521 Whitaker Ln
- 1009 Deena Way
- 1291 S Taylor St
- 861 W Center St
- 841 W Center St
- 360 & 360 1/2 W Virginia St
- 1091 Tiffany Dr
- 250 S Taylor St
- 1.55 Acres on S Maine St
- 345 Lincoln St
- 1205 S Maine St Unit 20
- 1205 S Maine St Unit 21
- 1205 S Maine St Unit 18
- 635 Churchill St
- 687 Douglas St
- 1044 Allen Rd
- 12017 Power Line Rd
- 301 Tolas Place Unit 8
- 361 Silver Spur Dr Unit 181155
- 009-291-74 00929174
- 980 Concord Ave
- 940 Concord Ave
- 961 Warwick Ave
- 1010 Concord Ave
- 981 Warwick Ave
- 930 Concord Ave
- 941 Warwick Ave
- 1000 James Ln
- 1011 Warwick Ave
- 1001 James Ln
- 1001 Dolores Ln
- 1020 Concord Ave
- 921 Warwick Ave
- 920 Concord Ave
- 1021 Warwick Ave
- 1010 James Ln
- 1011 Dolores Ln
- 911 Warwick Ave
- 1040 Concord Ave
- 960 Warwick Ave
Your Personal Tour Guide
Ask me questions while you tour the home.