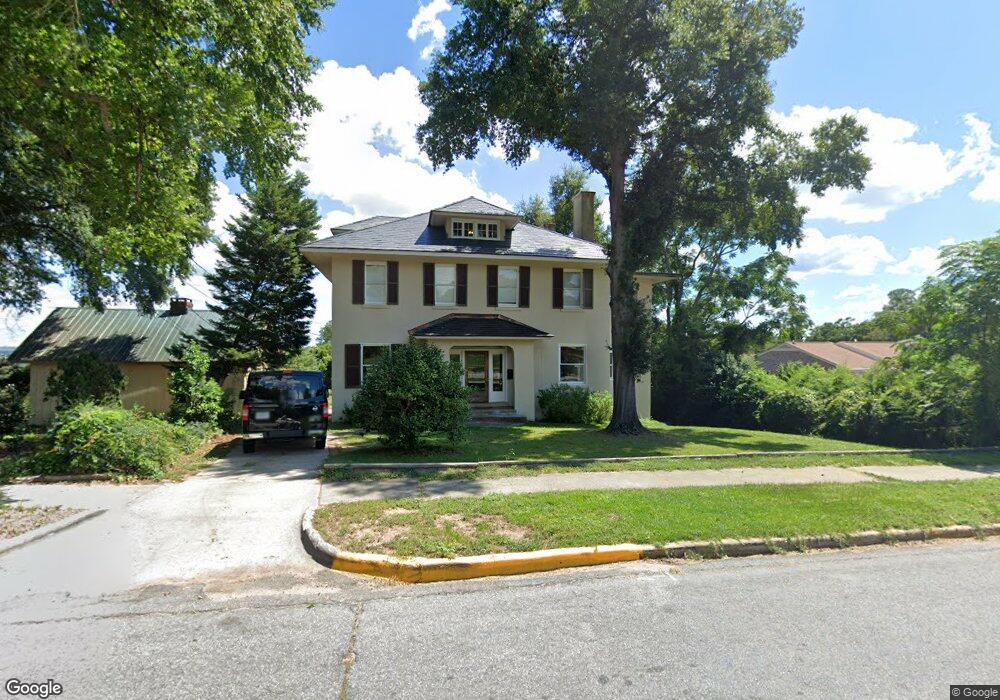
960 Hickman Rd Augusta, GA 30904
Summerville NeighborhoodEstimated Value: $407,000 - $828,824
4
Beds
4
Baths
3,659
Sq Ft
$186/Sq Ft
Est. Value
About This Home
This home is located at 960 Hickman Rd, Augusta, GA 30904 and is currently estimated at $680,206, approximately $185 per square foot. 960 Hickman Rd is a home located in Richmond County with nearby schools including Lake Forest Hills Elementary School, Johnson Magnet, and Tutt Middle School.
Ownership History
Date
Name
Owned For
Owner Type
Purchase Details
Closed on
Feb 25, 2014
Sold by
Haltermann Bryan M
Bought by
Robertson Thomas Heard Iii Rofs
Current Estimated Value
Home Financials for this Owner
Home Financials are based on the most recent Mortgage that was taken out on this home.
Original Mortgage
$208,877
Outstanding Balance
$155,893
Interest Rate
4.25%
Mortgage Type
New Conventional
Estimated Equity
$524,313
Purchase Details
Closed on
Jun 2, 2011
Sold by
Thevaos George P T
Bought by
Haltermann Bryan M
Home Financials for this Owner
Home Financials are based on the most recent Mortgage that was taken out on this home.
Original Mortgage
$75,000
Interest Rate
4.79%
Mortgage Type
Trade
Purchase Details
Closed on
Jun 13, 2006
Sold by
Thevaos Theo G
Bought by
Thevaos George Philip Theo
Purchase Details
Closed on
May 22, 2006
Sold by
Thevaos Deno G
Bought by
Thevaos Theo G
Purchase Details
Closed on
May 16, 2005
Sold by
Thevaos Theo G and Estate Of Helen A Thevaos
Bought by
Thevaos Deno G and Thevaos Theo G
Create a Home Valuation Report for This Property
The Home Valuation Report is an in-depth analysis detailing your home's value as well as a comparison with similar homes in the area
Home Values in the Area
Average Home Value in this Area
Purchase History
| Date | Buyer | Sale Price | Title Company |
|---|---|---|---|
| Robertson Thomas Heard Iii Rofs | $261,100 | -- | |
| Robertson Thomas Heard | $261,096 | -- | |
| Haltermann Bryan M | $125,000 | -- | |
| Thevaos George Philip Theo | -- | -- | |
| Thevaos George Philip Theo | -- | None Available | |
| Thevaos Theo G | -- | None Available | |
| Thevaos Deno G | -- | -- |
Source: Public Records
Mortgage History
| Date | Status | Borrower | Loan Amount |
|---|---|---|---|
| Open | Robertson Thomas Heard | $208,877 | |
| Closed | Robertson Thomas Heard | $53,000 | |
| Closed | Robertson Thomas Heard Iii Rofs | $208,877 | |
| Previous Owner | Thevaos George Philip Theo | $75,000 |
Source: Public Records
Tax History
| Year | Tax Paid | Tax Assessment Tax Assessment Total Assessment is a certain percentage of the fair market value that is determined by local assessors to be the total taxable value of land and additions on the property. | Land | Improvement |
|---|---|---|---|---|
| 2025 | $9,007 | $303,156 | $58,880 | $244,276 |
| 2024 | $9,007 | $295,152 | $58,880 | $236,272 |
| 2023 | $6,594 | $297,096 | $58,880 | $238,216 |
| 2022 | $4,993 | $243,433 | $58,880 | $184,553 |
| 2021 | $2,587 | $206,990 | $58,880 | $148,110 |
| 2020 | $2,550 | $151,470 | $49,248 | $102,222 |
| 2019 | $2,711 | $151,470 | $49,248 | $102,222 |
| 2018 | $2,732 | $151,470 | $49,248 | $102,222 |
| 2017 | $2,719 | $132,262 | $49,248 | $83,014 |
| 2016 | $2,720 | $132,262 | $49,248 | $83,014 |
| 2015 | $2,856 | $147,649 | $49,248 | $98,401 |
| 2014 | $2,919 | $147,649 | $49,248 | $98,401 |
Source: Public Records
Map
Nearby Homes
- 2110 Carnes Place
- 930 Heard Ave
- 956 Heard Ave
- 2201 Clayton Ln
- 2203 Clayton Ln
- 2207 Clayton Ln
- 911 Heard Ave
- 2211 Clayton Ln
- 2213 Clayton Ln
- 2016 Hampton Ave
- 925 B Russell St
- 978 Heard Ave
- 844 Heard Ave
- 1208 Hickman Rd
- 2144 Central Ave
- 812 Russell St
- 2232 Mcdowell St
- 1224 Meigs St
- 1213 Heard Ave
- 707 Hickman Rd
- 956 Hickman Rd
- Lot 121-122 Augusta
- 937 Hickman Rd
- 935 Hickman Rd
- 933 Hickman Rd
- 932 Meigs St
- 0 Hickman Rd
- 928 Meigs St
- 1010 Hickman Rd
- 1010 Hickman Rd Unit G2
- 1010 Hickman Rd
- 1010 Hickman Rd Unit G1
- 1010 Hickman Rd Unit F2
- 1010 Hickman Rd Unit F1
- 1010 Hickman Rd Unit E2
- 1010 Hickman Rd Unit E1
- 1010 Hickman Rd Unit J1
- 1010 Hickman Rd Unit D6
- 1010 Hickman Rd Unit D5
- 1010 Hickman Rd Unit D4
Your Personal Tour Guide
Ask me questions while you tour the home.