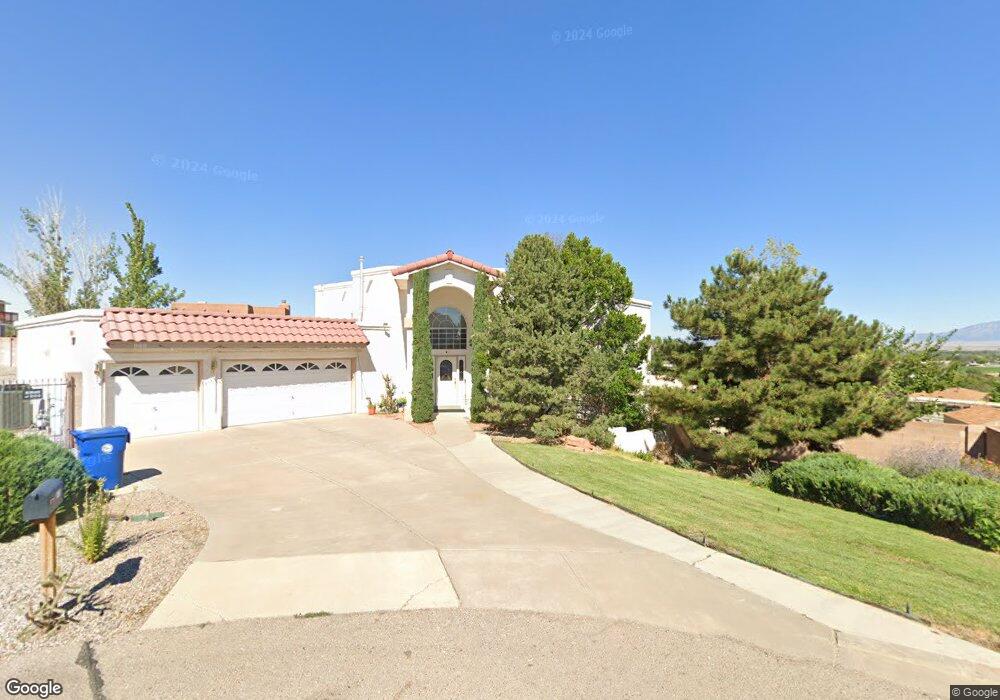
960 Hillside Cir SW Los Lunas, NM 87031
Estimated Value: $467,000 - $564,000
3
Beds
3
Baths
2,923
Sq Ft
$181/Sq Ft
Est. Value
About This Home
This home is located at 960 Hillside Cir SW, Los Lunas, NM 87031 and is currently estimated at $530,056, approximately $181 per square foot. 960 Hillside Cir SW is a home located in Valencia County with nearby schools including Raymond Gabaldon Elementary School, Los Lunas Middle School, and Los Lunas High School.
Ownership History
Date
Name
Owned For
Owner Type
Purchase Details
Closed on
Jan 25, 2024
Sold by
Sypteras Reiko
Bought by
Sypteras Warren
Current Estimated Value
Purchase Details
Closed on
Jul 5, 2016
Sold by
Sypteras Warren N
Bought by
Sypteras Reiko and Sypteras Warren N
Purchase Details
Closed on
Dec 1, 2010
Sold by
Lybrand Basil and Lybrand Judy
Bought by
Jaramillo Jeff M and Jaramillo Patricia
Home Financials for this Owner
Home Financials are based on the most recent Mortgage that was taken out on this home.
Original Mortgage
$178,000
Interest Rate
4.23%
Mortgage Type
New Conventional
Purchase Details
Closed on
Nov 30, 2010
Sold by
Jaramillo Jeff M and Jaramillo Patricia
Bought by
Sypteras Warren N
Home Financials for this Owner
Home Financials are based on the most recent Mortgage that was taken out on this home.
Original Mortgage
$178,000
Interest Rate
4.23%
Mortgage Type
New Conventional
Create a Home Valuation Report for This Property
The Home Valuation Report is an in-depth analysis detailing your home's value as well as a comparison with similar homes in the area
Home Values in the Area
Average Home Value in this Area
Purchase History
| Date | Buyer | Sale Price | Title Company |
|---|---|---|---|
| Sypteras Warren | -- | None Listed On Document | |
| Sypteras Reiko | -- | None Available | |
| Jaramillo Jeff M | -- | -- | |
| Sypteras Warren N | -- | -- |
Source: Public Records
Mortgage History
| Date | Status | Borrower | Loan Amount |
|---|---|---|---|
| Previous Owner | Sypteras Warren N | $178,000 |
Source: Public Records
Tax History Compared to Growth
Tax History
| Year | Tax Paid | Tax Assessment Tax Assessment Total Assessment is a certain percentage of the fair market value that is determined by local assessors to be the total taxable value of land and additions on the property. | Land | Improvement |
|---|---|---|---|---|
| 2024 | $4,173 | $128,017 | $11,583 | $116,434 |
| 2023 | $4,023 | $124,289 | $11,583 | $112,706 |
| 2022 | $3,955 | $120,669 | $11,583 | $109,086 |
| 2021 | $3,874 | $117,154 | $11,930 | $105,224 |
| 2020 | $3,831 | $113,742 | $11,583 | $102,159 |
| 2019 | $3,852 | $113,742 | $11,583 | $102,159 |
| 2018 | $3,673 | $110,430 | $11,583 | $98,847 |
| 2017 | $3,510 | $107,213 | $11,583 | $95,630 |
| 2016 | $3,411 | $104,091 | $11,583 | $92,508 |
| 2015 | -- | $101,059 | $11,583 | $89,476 |
| 2013 | -- | $95,258 | $11,583 | $83,675 |
| 2011 | -- | $277,452 | $33,738 | $243,714 |
Source: Public Records
Map
Nearby Homes
- 0 Drake Rd
- 1628 Drake Rd
- 981 Canal Blvd SW
- 1107 Valley View Dr SW
- 1330 Crestview Dr SW
- 1864 Villa Contesa Loop NW
- 1407 Valley View Dr SW
- 1034 Wagon Trail St
- 1551 Valley View Dr SW
- 1050 Wagon Trail St SW
- 0 Main Grant
- 1902 Valley View Dr SW
- 2258 Calle de Ortiz SW
- 2260 Calle de Alifas SW
- 2248 Calle de Silverio
- 1561 Corta Corona
- 1551 Corta Cancun
- 823 Corral St SW
- 1951 Corta Rustica Rd
- 600 Don Federico Ct SW
- 980 Hillside Cir SW
- 1511 Drake Rd SW
- 961 Hillside Cir SW
- 1535 Drake Rd SW
- 990 Hillside Cir SW
- 1463 Drake Rd SW
- 981 Hillside Cir SW
- 1603 Drake Rd SW
- 1603 Drake Rd SW
- 1420 Hillside Dr SW
- 991 Hillside Cir SW
- 0 Hillside Dr
- 0 Drake Rd
- 1400 Hillside Dr SW
- 1512 Drake Rd SW
- 1619 Drake Rd SW
- 1536 Drake Rd SW
- 1652 Hillside Dr SW
- 1444 Drake Rd
- 1509 Hillside Dr SW