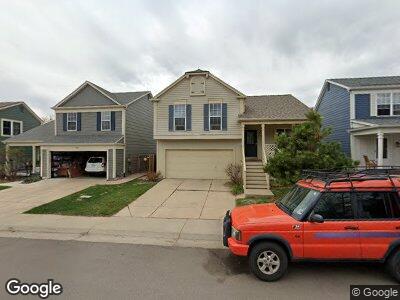
960 Mercury Dr Lafayette, CO 80026
Estimated Value: $577,392 - $614,000
3
Beds
2
Baths
1,164
Sq Ft
$508/Sq Ft
Est. Value
About This Home
This home is located at 960 Mercury Dr, Lafayette, CO 80026 and is currently estimated at $591,348, approximately $508 per square foot. 960 Mercury Dr is a home located in Boulder County with nearby schools including Ryan Elementary School, Angevine Middle School, and Centaurus High School.
Ownership History
Date
Name
Owned For
Owner Type
Purchase Details
Closed on
Apr 6, 2021
Sold by
Chu Shan Shan
Bought by
Chu Shan Shan and Tin Kao Chien
Current Estimated Value
Home Financials for this Owner
Home Financials are based on the most recent Mortgage that was taken out on this home.
Original Mortgage
$203,000
Interest Rate
3%
Mortgage Type
New Conventional
Purchase Details
Closed on
Oct 14, 1994
Sold by
Reese Ronald E
Bought by
Chu Shan Shan
Home Financials for this Owner
Home Financials are based on the most recent Mortgage that was taken out on this home.
Original Mortgage
$95,250
Interest Rate
8.46%
Purchase Details
Closed on
Oct 29, 1990
Bought by
Chu Shan Shan
Purchase Details
Closed on
Feb 7, 1990
Bought by
Chu Shan Shan
Purchase Details
Closed on
Apr 8, 1987
Bought by
Chu Shan Shan
Create a Home Valuation Report for This Property
The Home Valuation Report is an in-depth analysis detailing your home's value as well as a comparison with similar homes in the area
Home Values in the Area
Average Home Value in this Area
Purchase History
| Date | Buyer | Sale Price | Title Company |
|---|---|---|---|
| Chu Shan Shan | -- | Fitco | |
| Chu Shan Shan | $127,000 | -- | |
| Chu Shan Shan | $94,000 | -- | |
| Chu Shan Shan | -- | -- | |
| Chu Shan Shan | $89,000 | -- |
Source: Public Records
Mortgage History
| Date | Status | Borrower | Loan Amount |
|---|---|---|---|
| Open | Tin Kao Chien | $198,000 | |
| Closed | Chu Shan Shan | $203,000 | |
| Closed | Chu Shan Shan | $212,500 | |
| Closed | Chu Shan Shan | $138,000 | |
| Closed | Chu Shan Shan | $91,600 | |
| Closed | Chu Shan Shan | $95,250 |
Source: Public Records
Tax History Compared to Growth
Tax History
| Year | Tax Paid | Tax Assessment Tax Assessment Total Assessment is a certain percentage of the fair market value that is determined by local assessors to be the total taxable value of land and additions on the property. | Land | Improvement |
|---|---|---|---|---|
| 2024 | $2,876 | $32,157 | $11,513 | $20,644 |
| 2023 | $2,827 | $32,455 | $11,517 | $24,623 |
| 2022 | $2,434 | $25,909 | $8,993 | $16,916 |
| 2021 | $2,407 | $26,655 | $9,252 | $17,403 |
| 2020 | $2,367 | $25,897 | $7,436 | $18,461 |
| 2019 | $2,334 | $25,897 | $7,436 | $18,461 |
| 2018 | $2,063 | $22,594 | $7,128 | $15,466 |
| 2017 | $2,008 | $24,978 | $7,880 | $17,098 |
| 2016 | $1,815 | $19,772 | $5,731 | $14,041 |
| 2015 | $1,701 | $16,748 | $4,378 | $12,370 |
| 2014 | $1,448 | $16,748 | $4,378 | $12,370 |
Source: Public Records
Map
Nearby Homes
- 1035 Milo Cir Unit B
- 1032 Pegasus Place
- 911 Homer Cir
- 960 Milo Cir Unit B
- 1055 Milo Cir Unit A
- 1198 Milo Cir Unit A
- 880 Orion Dr
- 901 Delphi Dr
- 717 S Carr Ave
- 1250 Acropolis Dr
- 910 Sparta Dr
- 612 S Bermont Ave
- 718 Julian Cir
- 1105 Bacchus Dr Unit 8
- 1100 Bacchus Dr Unit A
- 1202 Warrior Way Unit A1202
- 714 S Longmont Ave
- 1902 Pioneer Cir
- 1715 Pioneer Cir
- 803 Old Wagon Trail Cir
- 960 Mercury Dr
- 950 Mercury Dr
- 970 Mercury Dr
- 1221 Mercury Dr
- 1231 Mercury Dr
- 940 Mercury Dr
- 1211 Mercury Dr
- 1241 Mercury Dr
- 1201 Mercury Dr
- 990 Mercury Dr
- 930 Mercury Dr
- 961 Mercury Dr
- 1251 Mercury Dr
- 1191 Mercury Dr
- 981 Homer Cir
- 971 Mercury Dr
- 990 Homer Cir
- 971 Homer Cir
- 1000 Mercury Dr
- 1003 Pegasus Place