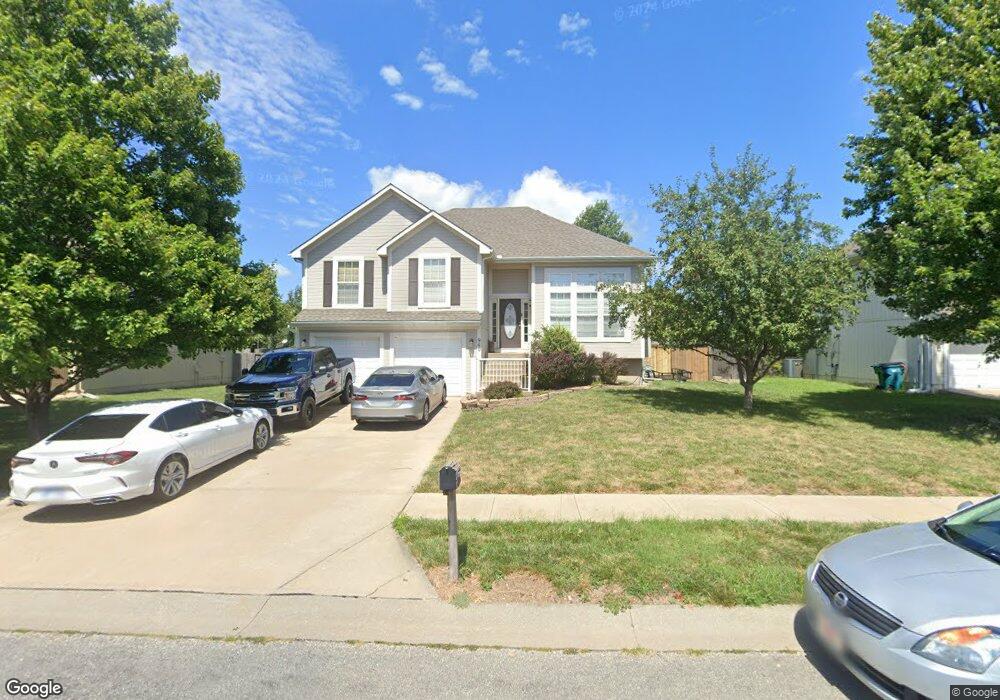
960 Oak Crest Dr Gardner, KS 66030
Gardner-Edgerton NeighborhoodEstimated Value: $334,081 - $345,000
4
Beds
3
Baths
1,419
Sq Ft
$238/Sq Ft
Est. Value
About This Home
This home is located at 960 Oak Crest Dr, Gardner, KS 66030 and is currently estimated at $337,770, approximately $238 per square foot. 960 Oak Crest Dr is a home located in Johnson County with nearby schools including Moonlight Elementary School, Trail Ridge Middle School, and Gardner Edgerton High School.
Ownership History
Date
Name
Owned For
Owner Type
Purchase Details
Closed on
Oct 19, 2007
Sold by
George Terry D and George Kerry L
Bought by
Tkg Properties Llc
Current Estimated Value
Purchase Details
Closed on
May 10, 2007
Sold by
First National Bank Of Omaha
Bought by
George Terry D and George Kerrly L
Purchase Details
Closed on
Apr 16, 2007
Sold by
Larsen Jason J and Larsen Carey M
Bought by
First National Bank Of Omaha
Purchase Details
Closed on
Sep 10, 2002
Sold by
Findley Homes Inc
Bought by
Larsen Jason J and Larsen Carey M
Home Financials for this Owner
Home Financials are based on the most recent Mortgage that was taken out on this home.
Original Mortgage
$154,891
Interest Rate
6.21%
Purchase Details
Closed on
Jun 11, 2002
Sold by
Bronte Homes Inc
Bought by
Findley Homes Inc
Home Financials for this Owner
Home Financials are based on the most recent Mortgage that was taken out on this home.
Original Mortgage
$120,000
Interest Rate
6.77%
Mortgage Type
Construction
Create a Home Valuation Report for This Property
The Home Valuation Report is an in-depth analysis detailing your home's value as well as a comparison with similar homes in the area
Home Values in the Area
Average Home Value in this Area
Purchase History
| Date | Buyer | Sale Price | Title Company |
|---|---|---|---|
| Tkg Properties Llc | -- | None Available | |
| George Terry D | -- | Chicago Title Insurnce Co | |
| First National Bank Of Omaha | $170,472 | None Available | |
| Larsen Jason J | -- | Guarantee Title | |
| Findley Homes Inc | -- | Guarantee Title |
Source: Public Records
Mortgage History
| Date | Status | Borrower | Loan Amount |
|---|---|---|---|
| Previous Owner | Larsen Jason J | $154,891 | |
| Previous Owner | Findley Homes Inc | $120,000 |
Source: Public Records
Tax History
| Year | Tax Paid | Tax Assessment Tax Assessment Total Assessment is a certain percentage of the fair market value that is determined by local assessors to be the total taxable value of land and additions on the property. | Land | Improvement |
|---|---|---|---|---|
| 2025 | $4,395 | $37,547 | $6,986 | $30,561 |
| 2024 | $4,395 | $35,937 | $6,986 | $28,951 |
| 2023 | $4,279 | $34,005 | $6,356 | $27,649 |
| 2022 | $4,122 | $32,384 | $5,672 | $26,712 |
| 2021 | $3,809 | $28,704 | $4,937 | $23,767 |
| 2020 | $3,383 | $24,932 | $4,937 | $19,995 |
| 2019 | $3,324 | $24,851 | $4,319 | $20,532 |
| 2018 | $3,328 | $24,368 | $4,319 | $20,049 |
| 2017 | $3,090 | $22,666 | $3,752 | $18,914 |
| 2016 | $2,900 | $21,114 | $3,752 | $17,362 |
| 2015 | $2,727 | $20,171 | $3,752 | $16,419 |
| 2013 | -- | $18,503 | $3,752 | $14,751 |
Source: Public Records
Map
Nearby Homes
- 573 Woodson Ln
- 962 E Wildcat Run St
- 565 S Cedar St
- 543 E Cheyenne St
- 1034 E Park St Unit 1034
- 106 Cattail Ct Unit 106
- 1070 E Park St Unit 1070
- 504 E Acorn St
- 0 E 175th St Unit HMS2609222
- 741 S Cypress St
- 747 S Cherry St
- 133 N White Dr
- Lot 26 Sycamore St
- 319 N Alder St
- 0000 Clare Rd
- 238 S Elm St
- 17746 Red Bird St
- 17747 Red Bird St
- 329 S Center St
- 841 E Lanesfield St
- 964 Oak Crest Dr
- 956 Oak Crest Dr
- 961 E Cottage Creek Dr
- 968 Oak Crest Dr
- 957 E Cottage Creek Dr
- 965 E Cottage Creek Dr
- 961 Oak Crest Dr
- 965 Oak Crest Dr
- 957 Oak Crest Dr
- 969 E Cottage Creek Dr
- 948 Oak Crest Dr
- 972 Oak Crest Dr
- 949 E Cottage Creek Dr
- 953 Oak Crest Dr
- 625 Oak Crest Cir
- 973 E Cottage Creek Dr
- 944 Oak Crest Dr
- 976 Oak Crest Dr
- 949 Oak Crest Dr
- 626 Oak Crest Cir
Your Personal Tour Guide
Ask me questions while you tour the home.