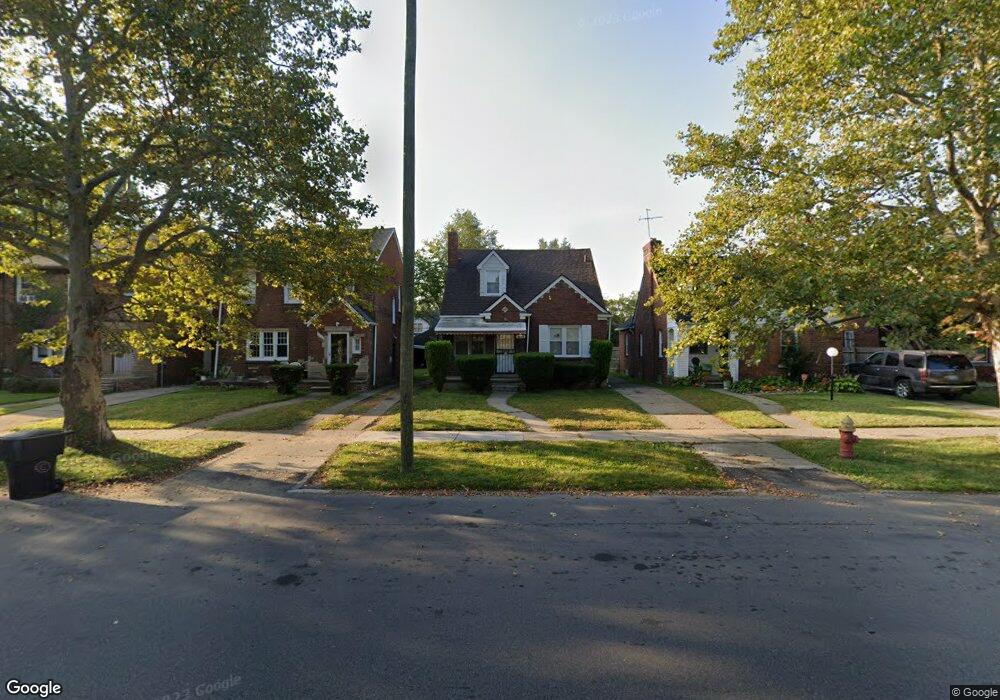
9600 E Outer Dr Detroit, MI 48213
Outer Drive-Hayes NeighborhoodEstimated Value: $69,345 - $114,000
Studio
1
Bath
1,256
Sq Ft
$70/Sq Ft
Est. Value
About This Home
This home is located at 9600 E Outer Dr, Detroit, MI 48213 and is currently estimated at $87,836, approximately $69 per square foot. 9600 E Outer Dr is a home located in Wayne County with nearby schools including Edward 'Duke' Ellington Conservatory of Music and Art, Charles L. Spain Elementary-Middle School, and Denby High School.
Ownership History
Date
Name
Owned For
Owner Type
Purchase Details
Closed on
May 19, 2014
Sold by
Boxstermb Llc
Bought by
Acp Nash Llc
Current Estimated Value
Purchase Details
Closed on
Sep 5, 2013
Sold by
Vhs Holdings Llc
Bought by
Boxstermb Llc
Purchase Details
Closed on
Nov 22, 2011
Sold by
Wayne County Treasurer
Bought by
Vhs Holdings Llc
Purchase Details
Closed on
Sep 24, 2006
Sold by
Hsbc Bank Usa Na
Bought by
Minardi Nick J
Purchase Details
Closed on
Jul 19, 2006
Sold by
Thomas Raymond
Bought by
Hsbc Bank Usa Na
Purchase Details
Closed on
Nov 30, 2005
Sold by
Complete Mortgage Corp
Bought by
Thomas Raymond
Purchase Details
Closed on
Nov 3, 2004
Sold by
Motor City Home Buyers Llc
Bought by
Complete Mortgage Corp
Purchase Details
Closed on
Sep 16, 2004
Sold by
Wrase Shirley L and Ezerski Nancy J
Bought by
Motor City Home Buyers Llc
Create a Home Valuation Report for This Property
The Home Valuation Report is an in-depth analysis detailing your home's value as well as a comparison with similar homes in the area
Home Values in the Area
Average Home Value in this Area
Purchase History
| Date | Buyer | Sale Price | Title Company |
|---|---|---|---|
| Acp Nash Llc | $55,500 | Advantage Title Company | |
| Boxstermb Llc | -- | None Available | |
| Vhs Holdings Llc | $6,000 | None Available | |
| Minardi Nick J | $30,000 | Attorneys Title Agency Llc | |
| Hsbc Bank Usa Na | $100,000 | None Available | |
| Thomas Raymond | $135,000 | Clearly Title | |
| Complete Mortgage Corp | $45,000 | Wilson Title Agency Llc | |
| Motor City Home Buyers Llc | $38,000 | Wilson Title Agency Llc |
Source: Public Records
Tax History
| Year | Tax Paid | Tax Assessment Tax Assessment Total Assessment is a certain percentage of the fair market value that is determined by local assessors to be the total taxable value of land and additions on the property. | Land | Improvement |
|---|---|---|---|---|
| 2025 | $1,084 | $22,800 | $0 | $0 |
| 2024 | $1,067 | $19,800 | $0 | $0 |
| 2023 | $1,035 | $15,500 | $0 | $0 |
| 2022 | $1,100 | $13,900 | $0 | $0 |
| 2021 | $1,071 | $11,300 | $0 | $0 |
| 2020 | $1,071 | $10,300 | $0 | $0 |
| 2019 | $1,055 | $9,400 | $0 | $0 |
| 2018 | $933 | $9,000 | $0 | $0 |
| 2017 | $186 | $9,800 | $0 | $0 |
| 2016 | $1,183 | $16,200 | $0 | $0 |
| 2015 | $1,250 | $12,500 | $0 | $0 |
| 2013 | $2,301 | $23,013 | $0 | $0 |
| 2010 | -- | $33,741 | $999 | $32,742 |
Source: Public Records
Map
Nearby Homes
- 9675 E Outer Dr
- 9722 E Outer Dr
- 14925 Wilshire Dr
- 14773 Kilbourne St
- 9776 E Outer Dr
- 14466 Chelsea Ave
- 10201 Hayes St
- 9810 E Outer Dr
- 14319 Rosemary St
- 14298 Chelsea St
- 14303 Rosemary St
- 10827 Bonita St
- 9892 E Outer Dr
- 10811 Bonita St
- 14728 Wilfred St
- 13388 Wilshire Dr
- 14258 Glenfield St
- 9500 Chalmers St
- 10801 Haverhill St
- 9973 E Outer Dr
- 9594 E Outer Dr
- 9606 E Outer Dr
- 9616 E Outer Dr
- 9584 E Outer Dr
- 9620 E Outer Dr
- 9580 E Outer Dr
- 14475 Promenade St
- 14465 Promenade St
- 14483 Promenade St
- 9570 E Outer Dr
- 9570 E Outer Dr
- 9630 E Outer Dr
- 14491 Promenade St
- 14457 Promenade St
- 14499 Promenade St
- 14449 Promenade St
- 9642 E Outer Dr
- 14505 Promenade St
- 14511 Promenade St
- 9560 E Outer Dr
Your Personal Tour Guide
Ask me questions while you tour the home.