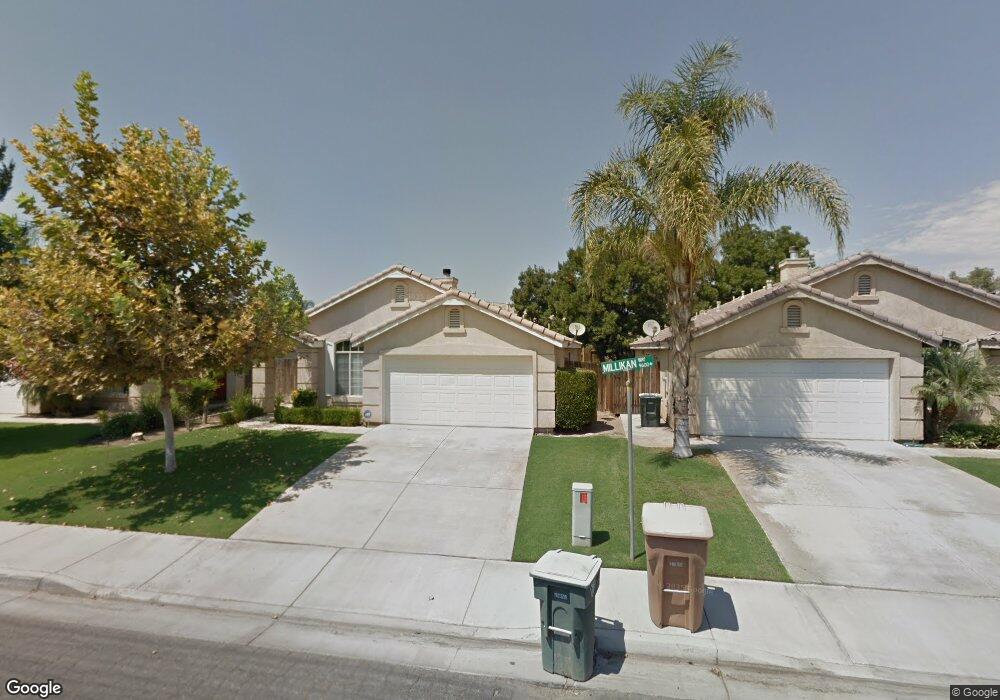
9600 Millikan Way Bakersfield, CA 93311
Gosford NeighborhoodEstimated Value: $331,000 - $379,000
3
Beds
2
Baths
1,091
Sq Ft
$323/Sq Ft
Est. Value
About This Home
This home is located at 9600 Millikan Way, Bakersfield, CA 93311 and is currently estimated at $351,977, approximately $322 per square foot. 9600 Millikan Way is a home located in Kern County with nearby schools including Sing Lum Elementary School, Tevis Junior High School, and Stockdale High School.
Ownership History
Date
Name
Owned For
Owner Type
Purchase Details
Closed on
Feb 6, 2004
Sold by
Morris Dawn
Bought by
Morris Robert and Morris Dawn
Current Estimated Value
Purchase Details
Closed on
Nov 7, 2002
Sold by
Morris Dawn and Morris Robert
Bought by
Morris Dawn
Home Financials for this Owner
Home Financials are based on the most recent Mortgage that was taken out on this home.
Original Mortgage
$93,800
Outstanding Balance
$39,578
Interest Rate
6.12%
Estimated Equity
$312,399
Purchase Details
Closed on
May 27, 1999
Sold by
Castle & Cooke California Inc
Bought by
Castle & Cooke California Inc and Castle & Cooke Homes California Inc
Home Financials for this Owner
Home Financials are based on the most recent Mortgage that was taken out on this home.
Original Mortgage
$89,412
Interest Rate
7.86%
Mortgage Type
FHA
Create a Home Valuation Report for This Property
The Home Valuation Report is an in-depth analysis detailing your home's value as well as a comparison with similar homes in the area
Home Values in the Area
Average Home Value in this Area
Purchase History
| Date | Buyer | Sale Price | Title Company |
|---|---|---|---|
| Morris Robert | -- | -- | |
| Morris Dawn | -- | First American Title | |
| Castle & Cooke California Inc | -- | American Title Co | |
| Wattell Dawn | $90,000 | American Title Co |
Source: Public Records
Mortgage History
| Date | Status | Borrower | Loan Amount |
|---|---|---|---|
| Open | Morris Dawn | $93,800 | |
| Previous Owner | Wattell Dawn | $89,412 | |
| Previous Owner | Castle & Cooke California Inc | $72,800 |
Source: Public Records
Tax History Compared to Growth
Tax History
| Year | Tax Paid | Tax Assessment Tax Assessment Total Assessment is a certain percentage of the fair market value that is determined by local assessors to be the total taxable value of land and additions on the property. | Land | Improvement |
|---|---|---|---|---|
| 2025 | $2,418 | $138,302 | $39,951 | $98,351 |
| 2024 | $2,377 | $135,591 | $39,168 | $96,423 |
| 2023 | $2,377 | $132,933 | $38,400 | $94,533 |
| 2022 | $2,281 | $130,328 | $37,648 | $92,680 |
| 2021 | $2,175 | $127,773 | $36,910 | $90,863 |
| 2020 | $2,130 | $126,464 | $36,532 | $89,932 |
| 2019 | $2,102 | $126,464 | $36,532 | $89,932 |
| 2018 | $2,018 | $121,555 | $35,114 | $86,441 |
| 2017 | $1,990 | $119,173 | $34,426 | $84,747 |
| 2016 | $1,878 | $116,837 | $33,751 | $83,086 |
| 2015 | $1,986 | $115,083 | $33,245 | $81,838 |
| 2014 | $1,946 | $112,829 | $32,594 | $80,235 |
Source: Public Records
Map
Nearby Homes
- 9608 Lacroix Ct
- 9408 Nickam Ct
- 9609 Salinger St
- 9813 Fitzgerald Dr
- 9704 Gold Dust Dr
- 9209 Campus Park Ct
- 3812 Millay Way
- 9008 Heely Ct
- 10126 Pyramid Peak Dr Unit 5
- 9902 Rancho Verde Dr
- 4000 Clancy Ct
- 9320 Cadbury Dr
- 4300 Keyes Ct
- 4400 Cron Way
- 10213 Single Oak Dr
- 10214 Pepperwood Dr
- 10015 Saint Albans Ave
- 3912 Cornerstone Way
- 9400 Hemingway Place
- 10016 Cobblestone Ave
- 9604 Millikan Way
- 9510 Millikan Way
- 9506 Millikan Way
- 9617 Goshen Ct
- 9615 Goshen Ct
- 9608 Millikan Way
- 9502 Millikan Way
- 9609 Goshen Ct
- 9511 Millikan Way
- 9601 Millikan Way
- 9404 Millikan Way
- 9605 Goshen Ct
- 9507 Millikan Way
- 4307 Tweeddale Dr
- 9609 Millikan Way
- 9503 Millikan Way
- 9400 Millikan Way
- 9601 Goshen Ct
- 9405 Millikan Way
- 4303 Tweeddale Dr