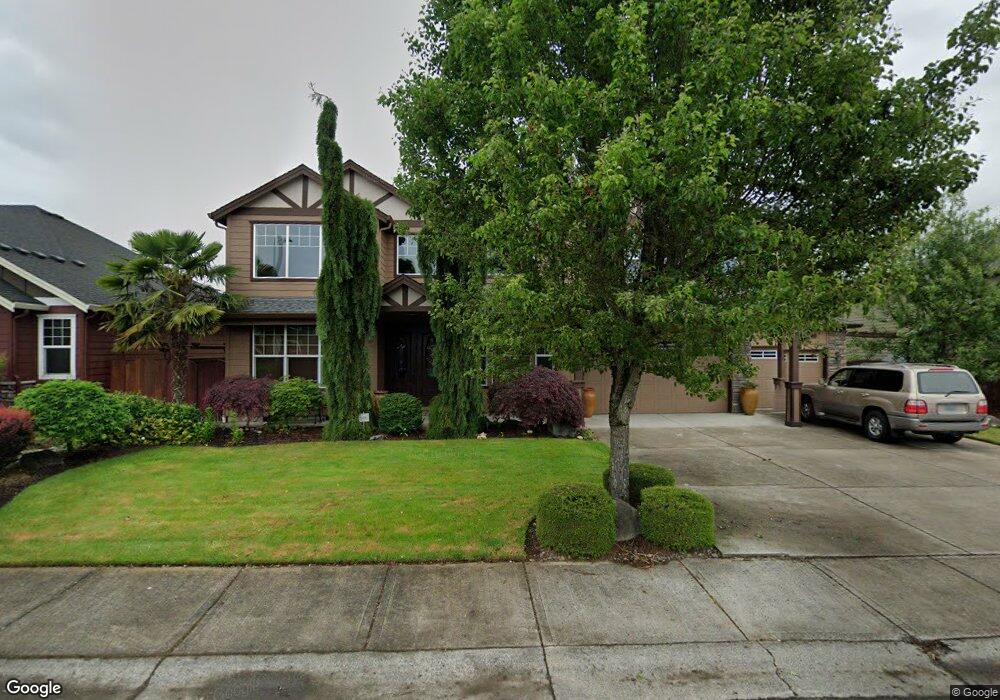
9600 NE 104th St Vancouver, WA 98662
Orchards Area NeighborhoodEstimated Value: $734,000 - $790,000
4
Beds
3
Baths
3,849
Sq Ft
$201/Sq Ft
Est. Value
About This Home
This home is located at 9600 NE 104th St, Vancouver, WA 98662 and is currently estimated at $774,404, approximately $201 per square foot. 9600 NE 104th St is a home located in Clark County with nearby schools including Glenwood Heights Primary School, Laurin Middle School, and Prairie High School.
Ownership History
Date
Name
Owned For
Owner Type
Purchase Details
Closed on
Mar 5, 2015
Sold by
Seistrup Gary
Bought by
Seistrup Roszeline
Current Estimated Value
Home Financials for this Owner
Home Financials are based on the most recent Mortgage that was taken out on this home.
Original Mortgage
$368,589
Outstanding Balance
$283,030
Interest Rate
3.75%
Mortgage Type
FHA
Estimated Equity
$491,374
Purchase Details
Closed on
Aug 3, 2005
Sold by
North Pointe Estates Inc
Bought by
Davidyan Grigory A and Davidyan Rodika M
Home Financials for this Owner
Home Financials are based on the most recent Mortgage that was taken out on this home.
Original Mortgage
$344,500
Interest Rate
5.37%
Mortgage Type
Fannie Mae Freddie Mac
Purchase Details
Closed on
Mar 1, 2005
Sold by
Brown Milton O
Bought by
North Pointe Estates Inc
Create a Home Valuation Report for This Property
The Home Valuation Report is an in-depth analysis detailing your home's value as well as a comparison with similar homes in the area
Home Values in the Area
Average Home Value in this Area
Purchase History
| Date | Buyer | Sale Price | Title Company |
|---|---|---|---|
| Seistrup Roszeline | -- | Columbia Title Agency | |
| Seistrup Roszeline | $405,000 | Columbia Title Agency | |
| Davidyan Grigory A | $430,650 | Cascade Title | |
| North Pointe Estates Inc | -- | Chicago Title Insurance | |
| North Pointe Estates Inc | $760,000 | Chicago Title Insurance |
Source: Public Records
Mortgage History
| Date | Status | Borrower | Loan Amount |
|---|---|---|---|
| Open | Seistrup Roszeline | $368,589 | |
| Previous Owner | Davidyan Grigory A | $344,500 |
Source: Public Records
Tax History Compared to Growth
Tax History
| Year | Tax Paid | Tax Assessment Tax Assessment Total Assessment is a certain percentage of the fair market value that is determined by local assessors to be the total taxable value of land and additions on the property. | Land | Improvement |
|---|---|---|---|---|
| 2025 | $5,800 | $780,933 | $179,200 | $601,733 |
| 2024 | $5,438 | $681,999 | $179,200 | $502,799 |
| 2023 | $5,570 | $707,046 | $182,000 | $525,046 |
| 2022 | $5,062 | $669,180 | $182,000 | $487,180 |
| 2021 | $5,149 | $551,740 | $154,000 | $397,740 |
| 2020 | $5,236 | $508,703 | $140,000 | $368,703 |
| 2019 | $4,518 | $504,037 | $101,500 | $402,537 |
| 2018 | $5,534 | $494,414 | $0 | $0 |
| 2017 | $4,936 | $460,652 | $0 | $0 |
| 2016 | $4,989 | $440,363 | $0 | $0 |
| 2015 | $4,624 | $409,702 | $0 | $0 |
| 2014 | -- | $358,396 | $0 | $0 |
| 2013 | -- | $329,986 | $0 | $0 |
Source: Public Records
Map
Nearby Homes
- 10414 NE 95th Ave
- 10809 NE 97th Ave
- 10006 NE 103rd St
- 10008 NE 92nd Ave
- 11034 NE 94th Ave
- 10315 NE 107th St
- 8927 NE 110th St
- 11108 NE 91st Ave
- 11118 NE 91st Ave
- 11114 NE 91st Ave
- 11116 NE 91st Ave
- 11122 NE 91st Ave
- 11013 NE 88th Ave
- 10412 NE 86th Ave
- 10704 NE 107th Ct
- 10417 NE 97th St
- 10414 NE 113th Cir
- 9610 NE 87th Ave
- 10820 NE 106th St
- 9701 NE 108th Ct
- 9606 NE 104th St
- 9514 NE 104th St
- 9607 NE 104th Way
- 9603 NE 104th Way
- 9615 NE 104th Way
- 9521 NE 104th St
- 9612 NE 104th St
- 9508 NE 104th St
- 9515 NE 104th St
- 9611 NE 104th St
- 9505 NE 104th Way
- 9509 NE 104th St
- 9705 NE 104th Way
- 9602 NE 103rd St
- 9702 NE 104th St
- 9502 NE 104th St
- 9608 NE 103rd St
- 9516 NE 103rd St
- 9610 NE 104th Way
- 9501 NE 104th Way