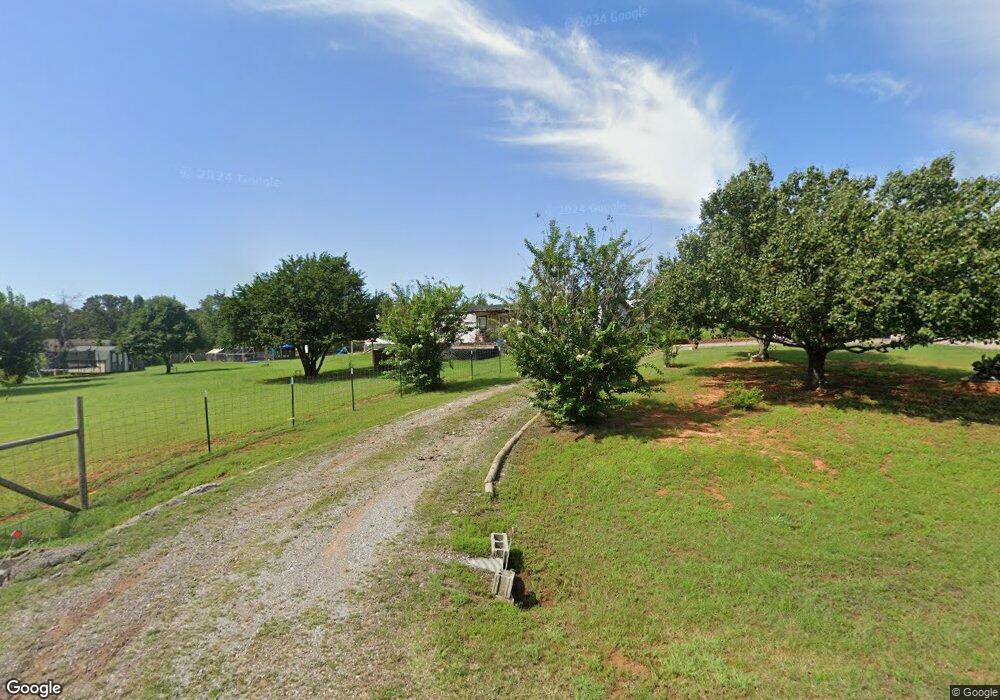
9601 Shady Ct Newalla, OK 74857
Estimated Value: $113,173 - $184,000
3
Beds
2
Baths
1,216
Sq Ft
$130/Sq Ft
Est. Value
About This Home
This home is located at 9601 Shady Ct, Newalla, OK 74857 and is currently estimated at $157,793, approximately $129 per square foot. 9601 Shady Ct is a home located in Cleveland County with nearby schools including McLoud Elementary School, McLoud Intermediate School, and McLoud Junior High School.
Ownership History
Date
Name
Owned For
Owner Type
Purchase Details
Closed on
Aug 6, 2021
Sold by
Bond Johnny Eugene
Bought by
Claycalyer Desirae Lee and Nix Trey Ashton
Current Estimated Value
Purchase Details
Closed on
Oct 1, 2012
Sold by
Dees Marvin L
Bought by
Bond Johnny Eugene
Home Financials for this Owner
Home Financials are based on the most recent Mortgage that was taken out on this home.
Original Mortgage
$53,000
Interest Rate
3.66%
Mortgage Type
Seller Take Back
Purchase Details
Closed on
Mar 9, 2012
Sold by
Widel Vickie L
Bought by
Dees Marvin L
Purchase Details
Closed on
Mar 8, 2012
Sold by
Olson Clarence M and Olson Gregory Wayne
Bought by
Dees Marvin L
Purchase Details
Closed on
Dec 26, 2006
Sold by
Sleepy Hollow Hills Llc
Bought by
Olson Reba Reece and Olson Clarence M
Purchase Details
Closed on
Dec 18, 2006
Sold by
Shamblin Ray and Shamblin Ethel M
Bought by
Sleepy Hollow Hills Llc
Create a Home Valuation Report for This Property
The Home Valuation Report is an in-depth analysis detailing your home's value as well as a comparison with similar homes in the area
Home Values in the Area
Average Home Value in this Area
Purchase History
| Date | Buyer | Sale Price | Title Company |
|---|---|---|---|
| Claycalyer Desirae Lee | -- | None Available | |
| Bond Johnny Eugene | $53,000 | None Available | |
| Dees Marvin L | -- | Stewart Abstract & Title Of | |
| Dees Marvin L | $25,000 | Stewart Abstract & Title Of | |
| Olson Reba Reece | $7,500 | None Available | |
| Sleepy Hollow Hills Llc | -- | None Available |
Source: Public Records
Mortgage History
| Date | Status | Borrower | Loan Amount |
|---|---|---|---|
| Previous Owner | Bond Johnny Eugene | $53,000 |
Source: Public Records
Tax History Compared to Growth
Tax History
| Year | Tax Paid | Tax Assessment Tax Assessment Total Assessment is a certain percentage of the fair market value that is determined by local assessors to be the total taxable value of land and additions on the property. | Land | Improvement |
|---|---|---|---|---|
| 2024 | $602 | $5,630 | $1,283 | $4,347 |
| 2023 | $575 | $5,362 | $1,780 | $3,582 |
| 2022 | $552 | $5,106 | $1,881 | $3,225 |
| 2021 | $564 | $5,177 | $1,767 | $3,410 |
| 2020 | $433 | $5,027 | $1,607 | $3,420 |
| 2019 | $431 | $4,880 | $1,818 | $3,062 |
| 2018 | $453 | $4,881 | $1,818 | $3,063 |
| 2017 | $458 | $4,881 | $0 | $0 |
| 2016 | $414 | $4,881 | $1,818 | $3,063 |
| 2015 | $423 | $4,881 | $1,818 | $3,063 |
| 2014 | $422 | $4,881 | $1,818 | $3,063 |
Source: Public Records
Map
Nearby Homes
- 9209 Hazy Brook Dr
- 20401 Misty Glen Dr
- 9000 Sleepy Hollow Dr
- 9117 S Dobbs Rd
- 9025 Hollow Rd
- 9000 Hollow Rd
- 29049 Oilfield Trash Dr
- 0 SE 97th Place
- 21301 SE 103rd St
- 9500 Megans Way
- 2501 SE 119th St
- 12201 Tamewood Dr
- 3307 S Dobbs Rd
- 3305 S Dobbs Rd
- 18220 SE 95th St
- 0 E 1140 Rd Unit 1176402
- 0 E 1140 Rd Unit 1135043
- 57 Country Creek Dr
- 12901 S Dobbs Rd
- 10701 Eastway
- 20124 SE 95th St
- 9609 Shady Ct
- 20116 SE 95th St
- 9521 Shady Meadow Way
- 20108 SE 95th St
- 9617 Shady Ct
- 20109 SE 95th St
- 9624 Shady Ct
- 9500 Shady Meadow Way
- 9505 Shady Meadow Way
- 20112 SE 94th St
- 9509 Sleepy Hollow Dr
- 9525 Sleepy Hollow Dr
- 20016 SE 95th St
- 9409 Sleepy Hollow Dr
- 9533 Sleepy Hollow Dr
- 9541 Sleepy Hollow Dr
- 9412 Shady Meadow Way