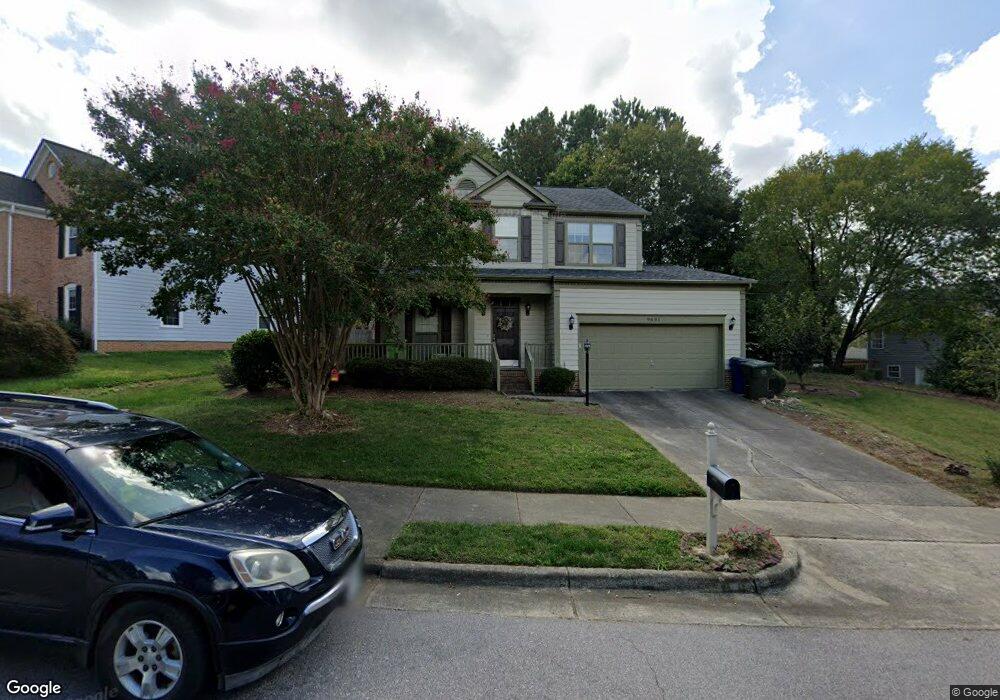
9601 Treymore Dr Raleigh, NC 27617
Umstead NeighborhoodEstimated Value: $461,000 - $483,433
3
Beds
3
Baths
1,774
Sq Ft
$266/Sq Ft
Est. Value
About This Home
This home is located at 9601 Treymore Dr, Raleigh, NC 27617 and is currently estimated at $471,358, approximately $265 per square foot. 9601 Treymore Dr is a home located in Wake County with nearby schools including Leesville Road Elementary School, Leesville Road Middle School, and Leesville Road High School.
Ownership History
Date
Name
Owned For
Owner Type
Purchase Details
Closed on
Oct 11, 2017
Sold by
Moon Tae Ok and Moon Kun Ho
Bought by
Ju Hye Yeon
Current Estimated Value
Home Financials for this Owner
Home Financials are based on the most recent Mortgage that was taken out on this home.
Original Mortgage
$137,500
Outstanding Balance
$114,851
Interest Rate
3.82%
Mortgage Type
New Conventional
Estimated Equity
$356,507
Purchase Details
Closed on
Sep 3, 2009
Sold by
Moon Se Chin and Lee Samuel S
Bought by
Moon Tae Ok
Home Financials for this Owner
Home Financials are based on the most recent Mortgage that was taken out on this home.
Original Mortgage
$207,000
Interest Rate
5.15%
Mortgage Type
New Conventional
Purchase Details
Closed on
Sep 26, 2003
Sold by
Lee David S and Yi Chae Su
Bought by
Moon Se Chin
Home Financials for this Owner
Home Financials are based on the most recent Mortgage that was taken out on this home.
Original Mortgage
$170,000
Interest Rate
8%
Mortgage Type
Purchase Money Mortgage
Create a Home Valuation Report for This Property
The Home Valuation Report is an in-depth analysis detailing your home's value as well as a comparison with similar homes in the area
Home Values in the Area
Average Home Value in this Area
Purchase History
| Date | Buyer | Sale Price | Title Company |
|---|---|---|---|
| Ju Hye Yeon | $265,000 | None Available | |
| Moon Tae Ok | $207,000 | None Available | |
| Moon Se Chin | $170,000 | -- |
Source: Public Records
Mortgage History
| Date | Status | Borrower | Loan Amount |
|---|---|---|---|
| Open | Ju Hye Yeon | $137,500 | |
| Previous Owner | Moon Tae Ok | $207,000 | |
| Previous Owner | Moon Se Chin | $170,000 |
Source: Public Records
Tax History Compared to Growth
Tax History
| Year | Tax Paid | Tax Assessment Tax Assessment Total Assessment is a certain percentage of the fair market value that is determined by local assessors to be the total taxable value of land and additions on the property. | Land | Improvement |
|---|---|---|---|---|
| 2025 | $4,612 | $526,564 | $170,000 | $356,564 |
| 2024 | $4,593 | $526,564 | $170,000 | $356,564 |
| 2023 | $3,118 | $284,194 | $80,000 | $204,194 |
| 2022 | $2,897 | $284,194 | $80,000 | $204,194 |
| 2021 | $2,785 | $284,194 | $80,000 | $204,194 |
| 2020 | $2,735 | $284,194 | $80,000 | $204,194 |
| 2019 | $2,644 | $226,384 | $70,000 | $156,384 |
| 2018 | $2,493 | $226,384 | $70,000 | $156,384 |
| 2017 | $2,375 | $226,384 | $70,000 | $156,384 |
| 2016 | $2,326 | $226,384 | $70,000 | $156,384 |
| 2015 | $2,322 | $222,331 | $66,000 | $156,331 |
| 2014 | $2,203 | $222,331 | $66,000 | $156,331 |
Source: Public Records
Map
Nearby Homes
- 9305 Langwood Dr
- 9800 Treymore Dr
- 9209 Shallcross Way
- 9337 Langwood Dr
- 13204 Ashford Park Dr
- 13217 Ashford Park Dr
- 9023 Colony Village Ln
- 6123 Blakeman Ln
- 7942 Berry Crest Ave
- 9309 Field Maple Ct
- 9305 Field Maple Ct
- 12909 Baybriar Dr
- 8228 Clarks Branch Dr
- 9413 Bells Valley Dr
- 8939 Camden Park Dr
- 9305 Dominion Blvd
- 10900 Bayflower Way
- 10901 Bayflower Way
- 10907 Bayflower Way
- 10906 Bayflower Way
- 9533 Treymore Dr
- 9218 Langwood Dr
- 9212 Langwood Dr
- 9529 Treymore Dr
- 9600 Treymore Dr
- 9206 Langwood Dr
- 9604 Treymore Dr
- 9700 Whiteclay Ct
- 9525 Treymore Dr
- 9204 Langwood Dr
- 9608 Treymore Dr
- 9532 Treymore Dr
- 9704 Whiteclay Ct
- 5305 Bartram Place
- 5301 Bartram Place
- 9521 Treymore Dr
- 5309 Bartram Place
- 9213 Langwood Dr
- 9217 Langwood Dr
- 5304 Pitch Pine Ct