Estimated Value: $397,000 - $429,000
4
Beds
3
Baths
2,231
Sq Ft
$186/Sq Ft
Est. Value
About This Home
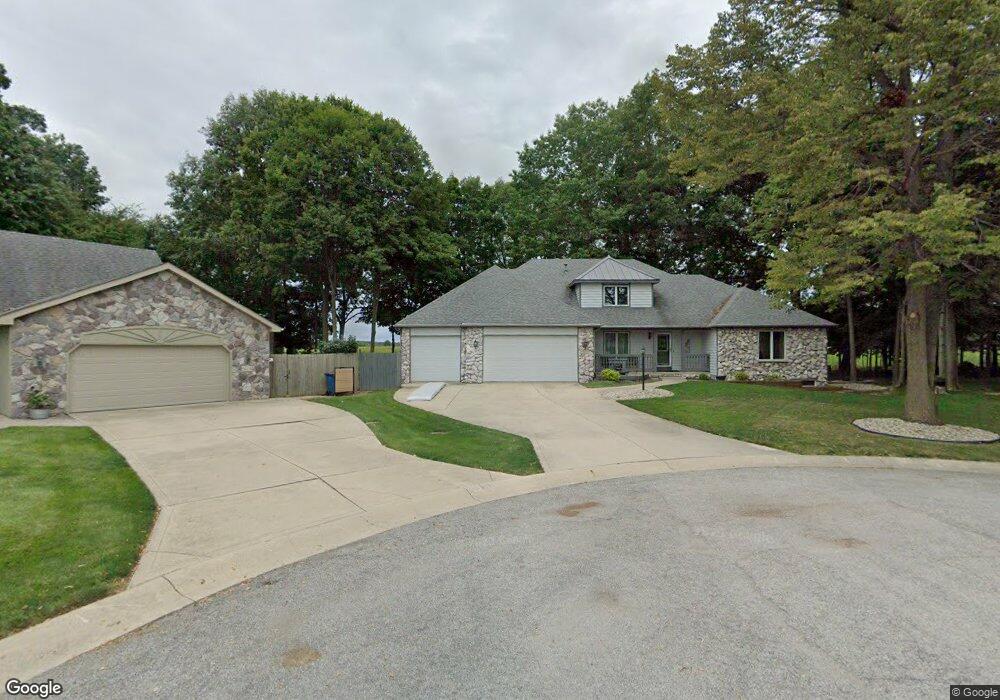
This home is located at 9602 Red Fox Way, Leo, IN 46765 and is currently estimated at $414,564, approximately $185 per square foot. 9602 Red Fox Way is a home located in Allen County with nearby schools including Leo Elementary School, Cedarville Elementary School, and Leo Junior/Senior High School.
Ownership History
Date
Name
Owned For
Owner Type
Purchase Details
Closed on
Mar 28, 2019
Sold by
Johnson Mark G and Johnson Kimberley E
Bought by
Johnson Mark G and Johnson Kimberley E
Current Estimated Value
Purchase Details
Closed on
May 25, 2007
Sold by
Conklin Barry A
Bought by
Johnson Mark G and Johnson Kimberley E
Home Financials for this Owner
Home Financials are based on the most recent Mortgage that was taken out on this home.
Original Mortgage
$142,768
Outstanding Balance
$87,078
Interest Rate
6.22%
Mortgage Type
Purchase Money Mortgage
Estimated Equity
$327,486
Purchase Details
Closed on
Dec 2, 2004
Sold by
Conklin Barry A and Conklin Kris A
Bought by
Conklin Barry A
Home Financials for this Owner
Home Financials are based on the most recent Mortgage that was taken out on this home.
Original Mortgage
$215,000
Interest Rate
6.95%
Mortgage Type
New Conventional
Create a Home Valuation Report for This Property
The Home Valuation Report is an in-depth analysis detailing your home's value as well as a comparison with similar homes in the area
Home Values in the Area
Average Home Value in this Area
Purchase History
| Date | Buyer | Sale Price | Title Company |
|---|---|---|---|
| Johnson Mark G | -- | None Available | |
| Johnson Mark G | -- | Lawyers Title | |
| Conklin Barry A | -- | First Land Title Company |
Source: Public Records
Mortgage History
| Date | Status | Borrower | Loan Amount |
|---|---|---|---|
| Open | Johnson Mark G | $142,768 | |
| Previous Owner | Conklin Barry A | $215,000 |
Source: Public Records
Tax History Compared to Growth
Tax History
| Year | Tax Paid | Tax Assessment Tax Assessment Total Assessment is a certain percentage of the fair market value that is determined by local assessors to be the total taxable value of land and additions on the property. | Land | Improvement |
|---|---|---|---|---|
| 2024 | $3,709 | $405,300 | $42,800 | $362,500 |
| 2022 | $3,390 | $358,900 | $42,800 | $316,100 |
| 2021 | $2,838 | $316,500 | $42,800 | $273,700 |
| 2020 | $2,513 | $277,600 | $42,800 | $234,800 |
| 2019 | $2,355 | $263,900 | $42,800 | $221,100 |
| 2018 | $2,452 | $262,900 | $42,800 | $220,100 |
| 2017 | $2,268 | $240,500 | $42,800 | $197,700 |
| 2016 | $2,180 | $233,100 | $42,800 | $190,300 |
| 2014 | $2,097 | $227,500 | $42,800 | $184,700 |
| 2013 | $2,080 | $222,800 | $42,800 | $180,000 |
Source: Public Records
Map
Nearby Homes
- 13638 Leo Rd
- 13234 Leo Rd
- 9318 Bobcat Trail
- 14315 Flint Creek Crossing
- 9116 Metea Valley Crossing
- 12707 Elsworth St
- 15114 Lions Passage
- 15026 Leo Creek Blvd
- 15309 Wild Meadow Place
- 15188 Leo Creek Blvd
- 15154 Annabelle Place
- 15208 Beulah Dr
- 10135 Donald Ave
- 15293 Leo Creek Blvd
- 15332 Annabelle Place
- 8578 Virgo Run
- 8025 Hosler Rd
- 15395 Makarios Pass Unit 32
- 10878 Conrad Creek Ct Unit 17
- 15535 Makarios Pass Unit 37
- 9608 Red Fox Way
- 9605 Red Fox Way
- 9614 Red Fox Way
- 9611 Red Fox Way
- 9528 Trading Post Rd
- 9617 Red Fox Way
- 9534 Trading Post Rd
- 9612 Trading Post Rd
- 9623 Red Fox Way
- 9626 Red Fox Way
- 9620 Trading Post Rd
- 13725 Blacksmith Run
- 13907 Covered Wagon Trail
- 9629 Red Fox Way
- 9632 Red Fox Way
- 9636 Trading Post Rd
- 9617 Trading Post Rd
- 13915 Covered Wagon Trail
- 9625 Trading Post Rd
- 9633 Trading Post Rd