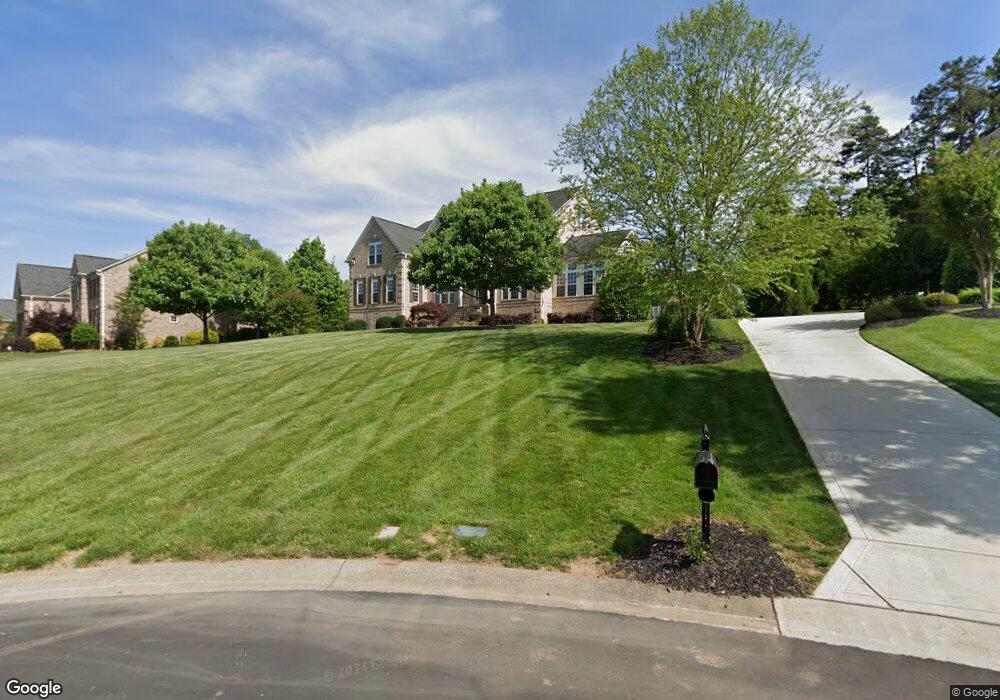
9602 Stonebridge Way Mint Hill, NC 28227
Estimated Value: $891,000 - $1,171,000
4
Beds
4
Baths
5,298
Sq Ft
$192/Sq Ft
Est. Value
About This Home
This home is located at 9602 Stonebridge Way, Mint Hill, NC 28227 and is currently estimated at $1,018,198, approximately $192 per square foot. 9602 Stonebridge Way is a home located in Mecklenburg County with nearby schools including Bain Elementary, Mint Hill Middle School, and Independence High.
Ownership History
Date
Name
Owned For
Owner Type
Purchase Details
Closed on
Nov 5, 2012
Sold by
Dixon Michael A and Dixon Linda D
Bought by
Miller Thomas G and Miller Geralyn A
Current Estimated Value
Home Financials for this Owner
Home Financials are based on the most recent Mortgage that was taken out on this home.
Original Mortgage
$314,735
Outstanding Balance
$218,924
Interest Rate
3.53%
Mortgage Type
New Conventional
Estimated Equity
$799,274
Purchase Details
Closed on
Apr 30, 2007
Sold by
Nvr Inc
Bought by
Dixon Michael A and Dixon Linda D
Home Financials for this Owner
Home Financials are based on the most recent Mortgage that was taken out on this home.
Original Mortgage
$527,496
Interest Rate
7.37%
Mortgage Type
Negative Amortization
Purchase Details
Closed on
Jan 22, 2007
Sold by
Stonebridge Of Mint Hill Llc
Bought by
Nvr Inc
Create a Home Valuation Report for This Property
The Home Valuation Report is an in-depth analysis detailing your home's value as well as a comparison with similar homes in the area
Home Values in the Area
Average Home Value in this Area
Purchase History
| Date | Buyer | Sale Price | Title Company |
|---|---|---|---|
| Miller Thomas G | $331,300 | None Available | |
| Dixon Michael A | $659,500 | None Available | |
| Nvr Inc | $73,500 | None Available |
Source: Public Records
Mortgage History
| Date | Status | Borrower | Loan Amount |
|---|---|---|---|
| Open | Miller Thomas G | $314,735 | |
| Previous Owner | Dixon Michael A | $527,496 |
Source: Public Records
Tax History Compared to Growth
Tax History
| Year | Tax Paid | Tax Assessment Tax Assessment Total Assessment is a certain percentage of the fair market value that is determined by local assessors to be the total taxable value of land and additions on the property. | Land | Improvement |
|---|---|---|---|---|
| 2025 | $5,255 | $735,100 | $150,000 | $585,100 |
| 2024 | $5,255 | $735,100 | $150,000 | $585,100 |
| 2023 | $5,176 | $735,100 | $150,000 | $585,100 |
| 2022 | $4,586 | $521,400 | $75,000 | $446,400 |
| 2021 | $4,586 | $521,400 | $75,000 | $446,400 |
| 2020 | $4,586 | $521,400 | $75,000 | $446,400 |
| 2019 | $4,580 | $521,400 | $75,000 | $446,400 |
| 2018 | $4,397 | $396,000 | $68,000 | $328,000 |
| 2017 | $4,323 | $396,000 | $68,000 | $328,000 |
| 2016 | $4,320 | $396,000 | $68,000 | $328,000 |
| 2015 | $4,316 | $396,000 | $68,000 | $328,000 |
| 2014 | $4,314 | $405,700 | $68,000 | $337,700 |
Source: Public Records
Map
Nearby Homes
- 12009 Wild Ginger Ln
- 12005 Wild Ginger Ln
- 8605 Carly Ln E
- 9420 Fairview Rd
- 8823 Dartmoor Place
- 8738 Dartmoor Place
- 8857 Dartmoor Place
- 8809 Fairview Rd
- 9113 Brief Rd
- 10110 Whispering Falls Ave
- 7933 Coral Ridge Dr
- 10321 Lemington Dr
- 9428 Liberty Hill Dr
- 8102 Rolling Fields Rd
- 7350 Purple Martin Way Unit 21
- 7342 Purple Martin Way Unit 19
- 7909 Plantation Falls Ln
- Portico Plan at The Courtyards at Quail Park
- Promenade Plan at The Courtyards at Quail Park
- Palazzo Plan at The Courtyards at Quail Park
- 9612 Stonebridge Way
- 8304 Slippery Creek Ln
- 8209 Castlestone Dr Unit 5
- 8209 Castlestone Dr
- 9622 Stonebridge Way
- 8305 Slippery Creek Ln
- 8201 Castlestone Dr
- 9605 Stonebridge Way
- 9632 Stonebridge Way
- 9550 Stonebridge Way
- 8143 Castlestone Dr
- 9549 Stonebridge Way
- 8132 Castlestone Dr
- 9625 Stonebridge Way
- 8144 Castlestone Dr
- 8144 Castlestone Dr Unit 6
- 8218 Castlestone Dr
- 8133 Castlestone Dr
- 8208 Castlestone Dr
- 9125 Echo Ln