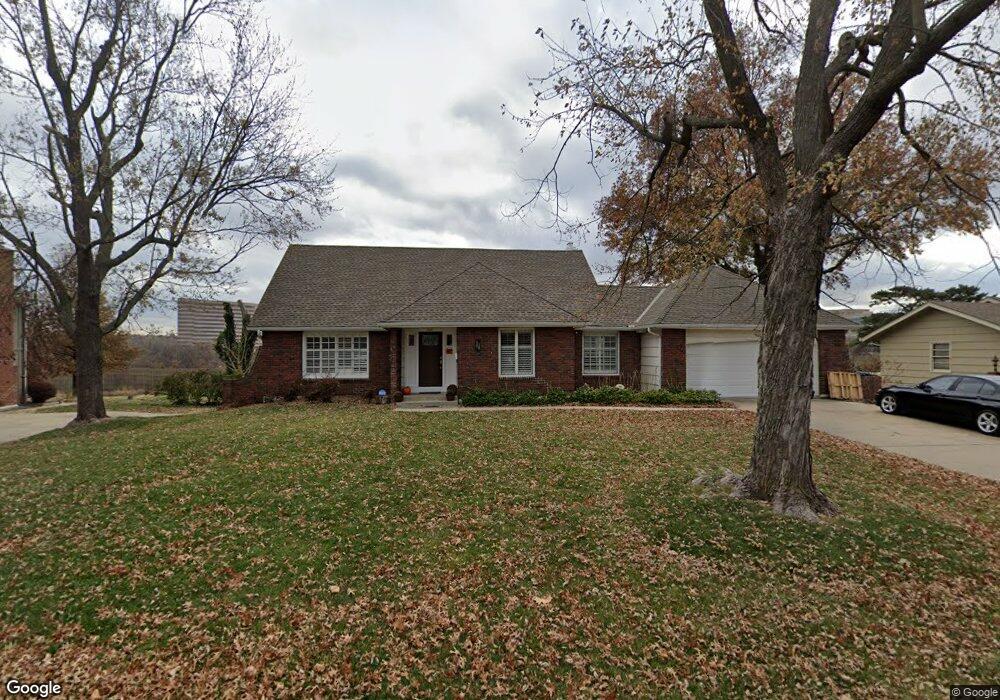
9605 W 106th St Overland Park, KS 66212
Oak Park NeighborhoodEstimated Value: $453,125 - $540,000
3
Beds
4
Baths
1,616
Sq Ft
$302/Sq Ft
Est. Value
About This Home
This home is located at 9605 W 106th St, Overland Park, KS 66212 and is currently estimated at $487,781, approximately $301 per square foot. 9605 W 106th St is a home located in Johnson County with nearby schools including Brookridge Elementary School, Shawnee Mission South High School, and Indian Woods Middle School.
Ownership History
Date
Name
Owned For
Owner Type
Purchase Details
Closed on
Aug 2, 2022
Sold by
Okamoto and Karen
Bought by
Boppana Jaya Naga Tirumal
Current Estimated Value
Home Financials for this Owner
Home Financials are based on the most recent Mortgage that was taken out on this home.
Original Mortgage
$361,000
Outstanding Balance
$345,648
Interest Rate
5.7%
Mortgage Type
New Conventional
Estimated Equity
$142,133
Purchase Details
Closed on
Sep 9, 2010
Sold by
Alterra Bank
Bought by
Okamoto Takeshi and Okamoto Karen
Purchase Details
Closed on
Aug 28, 2009
Sold by
Dreiling Michael J and Dreiling Patricia E
Bought by
1St Financial Bank
Purchase Details
Closed on
Oct 13, 2006
Sold by
Brightwell Patricia F
Bought by
Dreiling Michael J and Dreiling Patricia E
Home Financials for this Owner
Home Financials are based on the most recent Mortgage that was taken out on this home.
Original Mortgage
$165,600
Interest Rate
6.62%
Mortgage Type
Adjustable Rate Mortgage/ARM
Create a Home Valuation Report for This Property
The Home Valuation Report is an in-depth analysis detailing your home's value as well as a comparison with similar homes in the area
Home Values in the Area
Average Home Value in this Area
Purchase History
| Date | Buyer | Sale Price | Title Company |
|---|---|---|---|
| Boppana Jaya Naga Tirumal | -- | Platinum Title | |
| Okamoto Takeshi | -- | Chicago Title Ins Co | |
| 1St Financial Bank | -- | Chicago Title Ins Co | |
| Dreiling Michael J | -- | Kansas City Title |
Source: Public Records
Mortgage History
| Date | Status | Borrower | Loan Amount |
|---|---|---|---|
| Open | Boppana Jaya Naga Tirumal | $361,000 | |
| Previous Owner | Dreiling Michael J | $165,600 |
Source: Public Records
Tax History Compared to Growth
Tax History
| Year | Tax Paid | Tax Assessment Tax Assessment Total Assessment is a certain percentage of the fair market value that is determined by local assessors to be the total taxable value of land and additions on the property. | Land | Improvement |
|---|---|---|---|---|
| 2024 | $4,274 | $44,218 | $15,778 | $28,440 |
| 2023 | $4,221 | $43,068 | $15,778 | $27,290 |
| 2022 | $3,935 | $40,445 | $14,345 | $26,100 |
| 2021 | $3,599 | $35,236 | $12,475 | $22,761 |
| 2020 | $3,258 | $31,935 | $9,594 | $22,341 |
| 2019 | $2,765 | $27,151 | $7,376 | $19,775 |
| 2018 | $2,729 | $26,680 | $7,376 | $19,304 |
| 2017 | $2,262 | $21,781 | $7,376 | $14,405 |
| 2016 | $2,109 | $19,987 | $7,376 | $12,611 |
| 2015 | $2,007 | $19,423 | $7,376 | $12,047 |
| 2013 | -- | $17,353 | $7,376 | $9,977 |
Source: Public Records
Map
Nearby Homes
- 9805 W 104th Terrace
- 9701 W 104th St
- 8858 W 106th Terrace
- 9006 W 104th Terrace
- 8819 W 106th Terrace
- 8635 W 109th St
- 11163 Eby St
- 9222 W 101st St
- 8607 W 108 Place
- 9804 W 100th Terrace
- 10517 W 102nd Terrace
- 10000 Knox Dr
- 10634 W 102nd Terrace
- 9912 Knox Dr
- 9921 Wedd Dr
- 9206 W 100th St
- 9831 Carter Dr
- 11404 Grandview Dr
- 8500 W 113th St
- 8712 W 113th St
- 9701 W 106th St
- 9601 W 106th St
- 9705 W 106th St
- 9600 W 106th St
- 9505 W 106th St
- 9504 W 106th St
- 9704 W 106th St
- 9801 W 106th St
- 9501 W 106th St
- 9500 W 106th St
- 9409 W 106th St
- 9805 W 106th St
- 9408 W 106th St
- 9405 W 106th St
- 9404 W 106th St
- 9809 W 106th St
- 9701 W 105th Terrace
- 9705 W 105th Terrace
- 10533 Farley St
- 9605 W 105th Terrace