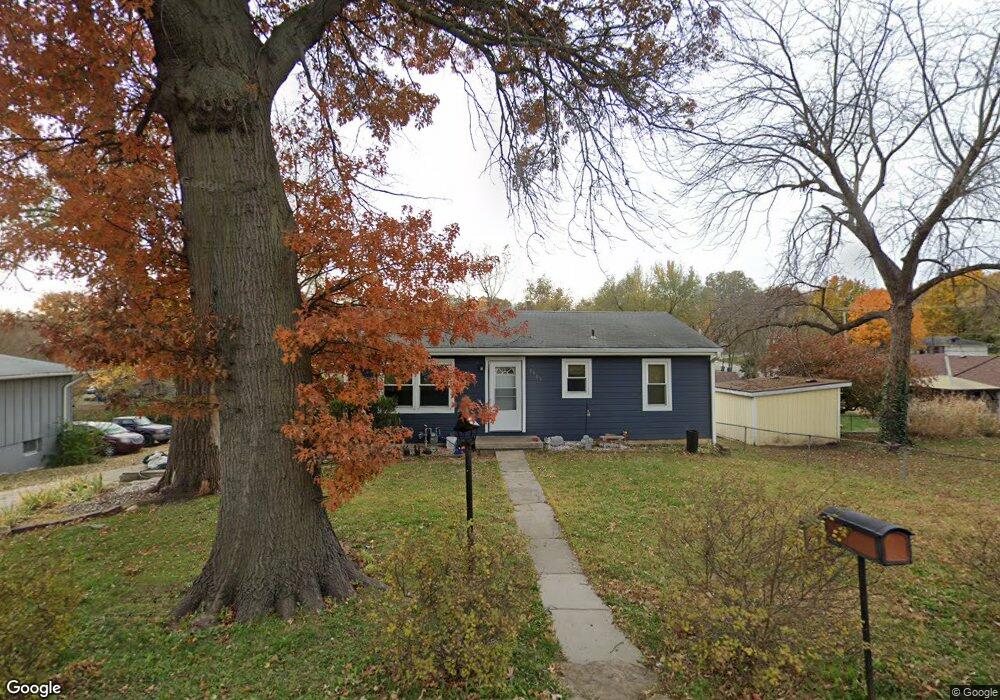
9605 W 54th St Shawnee, KS 66203
Estimated Value: $260,000 - $303,000
3
Beds
2
Baths
864
Sq Ft
$327/Sq Ft
Est. Value
About This Home
This home is located at 9605 W 54th St, Shawnee, KS 66203 and is currently estimated at $282,244, approximately $326 per square foot. 9605 W 54th St is a home located in Johnson County with nearby schools including Merriam Park Elementary School, Hocker Grove Middle School, and Shawnee Mission North High School.
Ownership History
Date
Name
Owned For
Owner Type
Purchase Details
Closed on
Jun 18, 2004
Sold by
Sherrer Doris Ellen and Jones Charles T
Bought by
Patrzykont Kevin and Patrzykont Darlene
Current Estimated Value
Home Financials for this Owner
Home Financials are based on the most recent Mortgage that was taken out on this home.
Original Mortgage
$133,941
Outstanding Balance
$66,398
Interest Rate
6.32%
Mortgage Type
FHA
Estimated Equity
$215,846
Purchase Details
Closed on
Oct 31, 2003
Sold by
Sherrer Doris Ellen
Bought by
Sherrer Doris Ellen and Jones Marilynn Sue
Purchase Details
Closed on
Aug 23, 2002
Sold by
Sherrer Doris Ellen and Springer Donna M
Bought by
Sherrer Doris Ellen
Purchase Details
Closed on
May 31, 2002
Sold by
Sherrer Doris Ellen and Springer Donna M
Bought by
Sherrer Doris Ellen and Springer Donna M
Create a Home Valuation Report for This Property
The Home Valuation Report is an in-depth analysis detailing your home's value as well as a comparison with similar homes in the area
Home Values in the Area
Average Home Value in this Area
Purchase History
| Date | Buyer | Sale Price | Title Company |
|---|---|---|---|
| Patrzykont Kevin | -- | Old Republic Title Of Kansas | |
| Sherrer Doris Ellen | -- | -- | |
| Sherrer Doris Ellen | -- | -- | |
| Sherrer Doris Ellen | -- | -- |
Source: Public Records
Mortgage History
| Date | Status | Borrower | Loan Amount |
|---|---|---|---|
| Open | Patrzykont Kevin | $133,941 |
Source: Public Records
Tax History Compared to Growth
Tax History
| Year | Tax Paid | Tax Assessment Tax Assessment Total Assessment is a certain percentage of the fair market value that is determined by local assessors to be the total taxable value of land and additions on the property. | Land | Improvement |
|---|---|---|---|---|
| 2024 | $3,120 | $29,452 | $5,325 | $24,127 |
| 2023 | $2,972 | $28,486 | $5,325 | $23,161 |
| 2022 | $2,718 | $25,139 | $4,837 | $20,302 |
| 2021 | $2,503 | $22,069 | $4,391 | $17,678 |
| 2020 | $2,299 | $20,148 | $3,821 | $16,327 |
| 2019 | $2,302 | $20,148 | $3,322 | $16,826 |
| 2018 | $2,083 | $18,182 | $3,018 | $15,164 |
| 2017 | $2,074 | $17,848 | $3,018 | $14,830 |
| 2016 | $1,920 | $16,353 | $3,018 | $13,335 |
| 2015 | $1,868 | $16,043 | $3,018 | $13,025 |
| 2013 | -- | $15,019 | $3,018 | $12,001 |
Source: Public Records
Map
Nearby Homes
- 9719 W 53rd St
- 5517 Hayes St
- 5220 Hayes St
- 10116 W 52nd Terrace
- 9328 W 51st St
- 5003 Knox Ave
- The Fleetwood Plan at Bristol Highlands - The Villas
- The Kirkwood Plan at Bristol Highlands - The Villas
- The Rockwood Plan at Bristol Highlands - The Villas
- 8613 W 54th Terrace
- 0 W 49th St
- 9201 W 48th Terrace
- 9012 W 49th St
- 10511 W 49th Place
- 11002 W 55th Terrace
- 5308 Mcanany Dr
- 8510 W 61st St
- 4820 Hadley St
- 5405 Oliver St
- 5232 Lowell St
- 9521 W 54th St Unit 9523
- 5407 Knox St
- 5401 Knox St
- 5409 Knox St
- 9515 W 54th St
- 9534 W 55th St
- 9540 W 55th St
- 9604 W 54th St
- 9524 W 55th St
- 0 Knox St Unit 1474365
- 0 Knox St Unit 1613062
- 9620 W 54th St
- 9622 W 55th St
- 9524 W 54th St
- 9511 W 54th St
- 5410 Knox Ave
- 5414 Knox Ave
- 5414 Knox St
- 5418 Knox Ave
- 9514 W 55th St