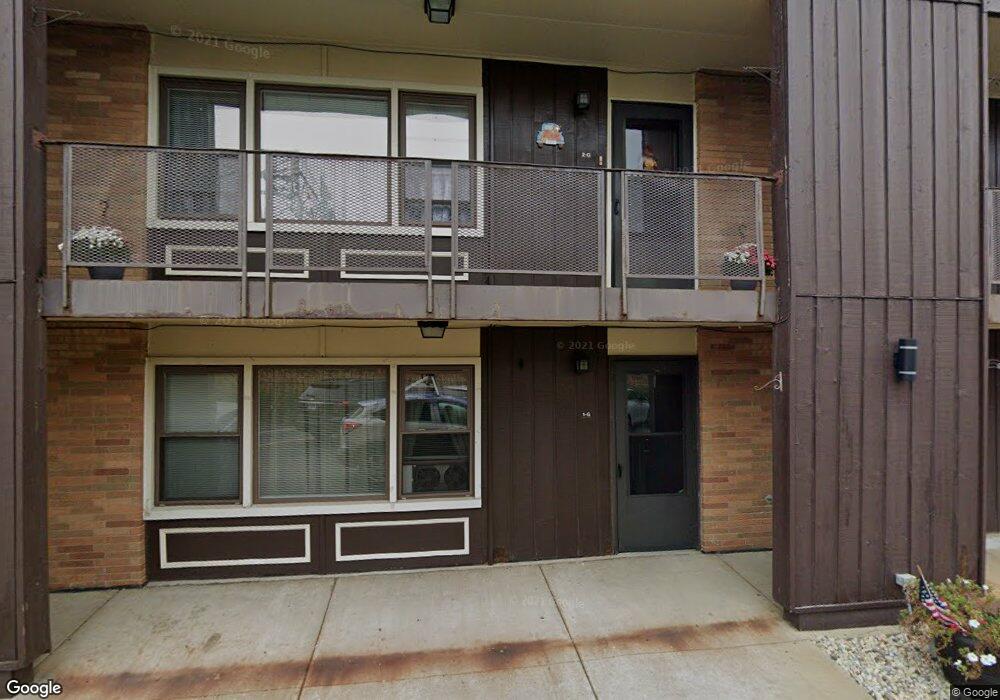
9606 W Higgins Rd Unit 2D Rosemont, IL 60018
Estimated Value: $194,987 - $213,000
2
Beds
--
Bath
870
Sq Ft
$236/Sq Ft
Est. Value
About This Home
This home is located at 9606 W Higgins Rd Unit 2D, Rosemont, IL 60018 and is currently estimated at $205,747, approximately $236 per square foot. 9606 W Higgins Rd Unit 2D is a home located in Cook County with nearby schools including Rosemont Elementary School, East Leyden High School, and Brickton Montessori School.
Ownership History
Date
Name
Owned For
Owner Type
Purchase Details
Closed on
Jun 25, 2020
Sold by
Watrach Joseph E
Bought by
Stephens Raquel M
Current Estimated Value
Home Financials for this Owner
Home Financials are based on the most recent Mortgage that was taken out on this home.
Original Mortgage
$156,750
Interest Rate
3.5%
Mortgage Type
New Conventional
Purchase Details
Closed on
Jun 19, 1998
Sold by
Hanger James W
Bought by
Watrach Joseph E
Home Financials for this Owner
Home Financials are based on the most recent Mortgage that was taken out on this home.
Original Mortgage
$90,250
Interest Rate
7.27%
Purchase Details
Closed on
Jul 22, 1995
Sold by
Hasselberger Larry William and Hasselberger Anita
Bought by
Hanger James W
Home Financials for this Owner
Home Financials are based on the most recent Mortgage that was taken out on this home.
Original Mortgage
$60,000
Interest Rate
7.56%
Create a Home Valuation Report for This Property
The Home Valuation Report is an in-depth analysis detailing your home's value as well as a comparison with similar homes in the area
Home Values in the Area
Average Home Value in this Area
Purchase History
| Date | Buyer | Sale Price | Title Company |
|---|---|---|---|
| Stephens Raquel M | $165,000 | Chicago Title | |
| Watrach Joseph E | $98,000 | -- | |
| Hanger James W | $88,000 | -- |
Source: Public Records
Mortgage History
| Date | Status | Borrower | Loan Amount |
|---|---|---|---|
| Previous Owner | Stephens Raquel M | $156,750 | |
| Previous Owner | Watrach Joseph E | $90,250 | |
| Previous Owner | Hanger James W | $60,000 |
Source: Public Records
Tax History Compared to Growth
Tax History
| Year | Tax Paid | Tax Assessment Tax Assessment Total Assessment is a certain percentage of the fair market value that is determined by local assessors to be the total taxable value of land and additions on the property. | Land | Improvement |
|---|---|---|---|---|
| 2024 | $3,244 | $15,898 | $1,480 | $14,418 |
| 2023 | $3,317 | $15,898 | $1,480 | $14,418 |
| 2022 | $3,317 | $15,898 | $1,480 | $14,418 |
| 2021 | $2,686 | $12,207 | $1,048 | $11,159 |
| 2020 | $3,668 | $12,207 | $1,048 | $11,159 |
| 2019 | $3,351 | $13,565 | $1,048 | $12,517 |
| 2018 | $2,896 | $10,659 | $925 | $9,734 |
| 2017 | $2,956 | $10,659 | $925 | $9,734 |
| 2016 | $2,728 | $10,659 | $925 | $9,734 |
| 2015 | $2,421 | $9,141 | $801 | $8,340 |
| 2014 | $2,418 | $9,141 | $801 | $8,340 |
| 2013 | $2,316 | $9,141 | $801 | $8,340 |
Source: Public Records
Map
Nearby Homes
- 9614 W Higgins Rd Unit 3A
- 2993 Curtis St Unit C41
- 1840 Nimitz Dr
- 2500 Windsor Mall Unit 1J
- 500 Thames Pkwy Unit 1F
- 2300 Windsor Mall Unit 1F
- 2300 Windsor Mall Unit 2E
- 2609 Eisenhower Dr
- 1757 Farwell Ave
- 2166 Laura Ln
- 414 S Dee Rd Unit 13
- 1966 Laura Ln
- 200 Thames Pkwy Unit 1
- 2646 Maple St
- 929 S Aldine Ave
- 1219 S Western Ave
- 38 E Touhy Ave
- 1401 Park Ridge Blvd
- 516 Engel Blvd
- 60 S Dee Rd Unit G
- 9606 W Higgins Rd Unit 3C
- 9606 W Higgins Rd Unit 3F
- 9606 W Higgins Rd Unit 3D
- 9606 W Higgins Rd Unit 2A
- 9606 W Higgins Rd Unit 1D
- 9606 W Higgins Rd Unit 1E
- 9606 W Higgins Rd Unit 2F
- 9606 W Higgins Rd Unit 3A
- 9606 W Higgins Rd Unit 3B
- 9606 W Higgins Rd Unit 1F
- 9606 W Higgins Rd
- 9606 W Higgins Rd Unit 3E
- 9610 W Higgins Rd Unit 1C
- 9612 W Higgins Rd Unit 3F
- 9610 W Higgins Rd Unit 1B
- 9612 W Higgins Rd Unit 1F
- 9610 W Higgins Rd Unit 3A
- 9612 W Higgins Rd Unit 1D
- 9612 W Higgins Rd Unit 2F
- 9610 W Higgins Rd Unit 3B