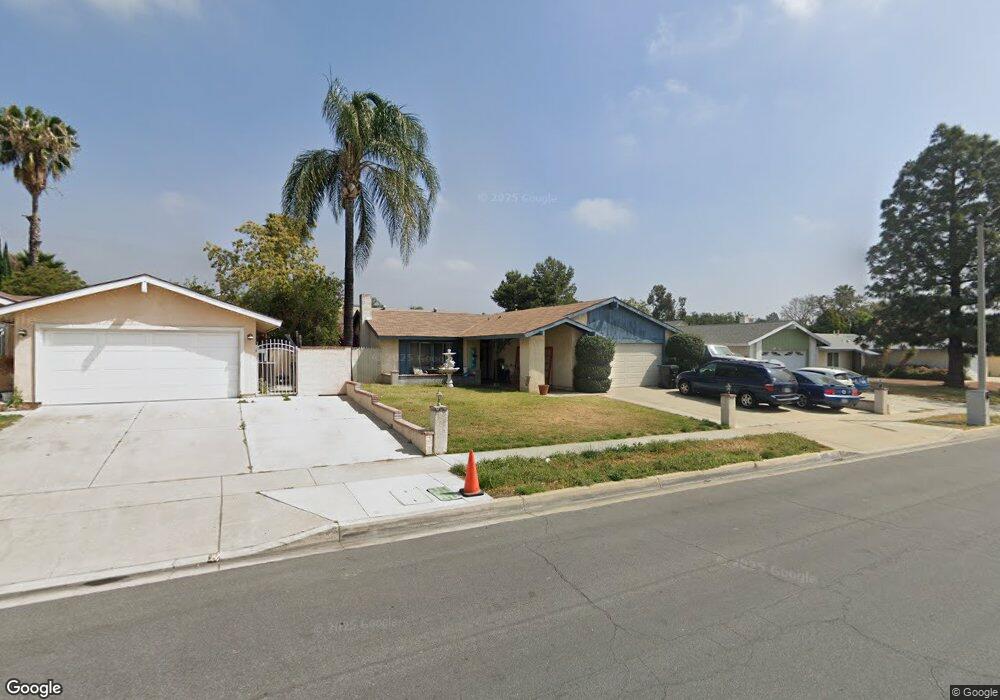
9608 Langston St Rancho Cucamonga, CA 91730
Estimated Value: $693,396 - $745,000
3
Beds
2
Baths
1,854
Sq Ft
$391/Sq Ft
Est. Value
About This Home
This home is located at 9608 Langston St, Rancho Cucamonga, CA 91730 and is currently estimated at $724,349, approximately $390 per square foot. 9608 Langston St is a home located in San Bernardino County with nearby schools including Central Elementary, Cucamonga Middle, and Alta Loma High.
Ownership History
Date
Name
Owned For
Owner Type
Purchase Details
Closed on
Oct 20, 2007
Sold by
Davenport Benny A
Bought by
Davenport Benny A and Davenport Frances
Current Estimated Value
Home Financials for this Owner
Home Financials are based on the most recent Mortgage that was taken out on this home.
Original Mortgage
$155,000
Interest Rate
6.29%
Mortgage Type
Purchase Money Mortgage
Create a Home Valuation Report for This Property
The Home Valuation Report is an in-depth analysis detailing your home's value as well as a comparison with similar homes in the area
Home Values in the Area
Average Home Value in this Area
Purchase History
| Date | Buyer | Sale Price | Title Company |
|---|---|---|---|
| Davenport Benny A | -- | First American Title |
Source: Public Records
Mortgage History
| Date | Status | Borrower | Loan Amount |
|---|---|---|---|
| Closed | Davenport Benny A | $155,000 |
Source: Public Records
Tax History Compared to Growth
Tax History
| Year | Tax Paid | Tax Assessment Tax Assessment Total Assessment is a certain percentage of the fair market value that is determined by local assessors to be the total taxable value of land and additions on the property. | Land | Improvement |
|---|---|---|---|---|
| 2025 | $2,843 | $259,416 | $90,889 | $168,527 |
| 2024 | $2,843 | $254,330 | $89,107 | $165,223 |
| 2023 | $2,781 | $249,343 | $87,360 | $161,983 |
| 2022 | $2,737 | $244,454 | $85,647 | $158,807 |
| 2021 | $2,737 | $239,661 | $83,968 | $155,693 |
| 2020 | $2,659 | $237,204 | $83,107 | $154,097 |
| 2019 | $2,647 | $232,552 | $81,477 | $151,075 |
| 2018 | $2,573 | $227,992 | $79,879 | $148,113 |
| 2017 | $2,527 | $223,522 | $78,313 | $145,209 |
| 2016 | $2,497 | $219,139 | $76,777 | $142,362 |
| 2015 | $2,471 | $215,848 | $75,624 | $140,224 |
| 2014 | $2,400 | $211,620 | $74,143 | $137,477 |
Source: Public Records
Map
Nearby Homes
- 9599 Church St
- 9684 Hemlock St
- 9757 Louise Way
- 7730 Layton St
- 9706 Bodega Ct
- 9812 Casiano Ct
- 7864 Portola Rd
- 9364 Langston St
- 9854 Madera Ct
- 7534 Layton St
- 9880 Madera Ct
- 9464 Magnolia St
- 9967 Yew Ct
- 9471 Jack Rabbit Dr Unit 107
- 7739 Lion St
- 8024 Tulsa Place
- 7315 Klusman Ave
- 7649 Dartmouth Ave
- 9340 Foothill Blvd Unit 68
- 9340 Foothill Blvd Unit 61
- 9618 Langston St
- 9598 Langston St
- 9613 Church St
- 9626 Langston St
- 9590 Langston St
- 9623 Church St
- 9589 Church St
- 9605 Langston St
- 9617 Langston St
- 9633 Church St
- 9636 Langston St
- 9580 Langston St
- 9595 Langston St
- 9627 Langston St
- 9579 Church St
- 9585 Langston St
- 9645 Church St
- 9637 Langston St
- 9646 Langston St
- 9570 Langston St