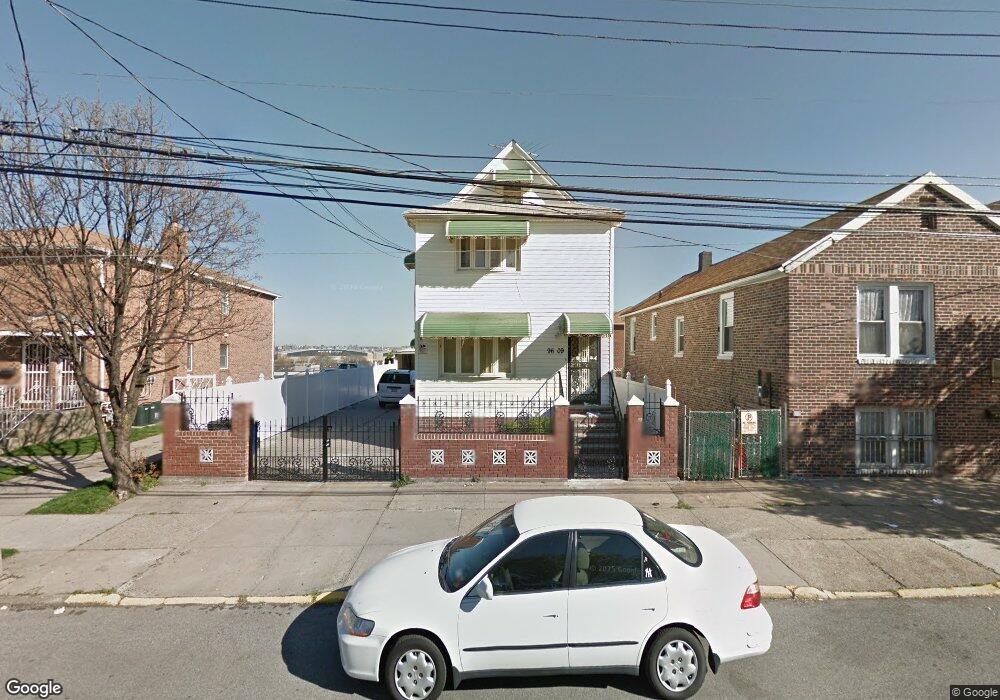
9609 23rd Ave Flushing, NY 11369
East Elmhurst NeighborhoodEstimated Value: $892,731 - $1,008,000
3
Beds
3
Baths
972
Sq Ft
$965/Sq Ft
Est. Value
About This Home
This home is located at 9609 23rd Ave, Flushing, NY 11369 and is currently estimated at $938,183, approximately $965 per square foot. 9609 23rd Ave is a home located in Queens County with nearby schools including P.S. 127 Aerospace Science Magnet School, I.S. 145 Joseph Pulitzer Magnet School, and William Cullen Bryant High School.
Ownership History
Date
Name
Owned For
Owner Type
Purchase Details
Closed on
Mar 16, 2017
Sold by
Nunez Josefina
Bought by
Chasi Jose
Current Estimated Value
Home Financials for this Owner
Home Financials are based on the most recent Mortgage that was taken out on this home.
Original Mortgage
$600,000
Outstanding Balance
$497,275
Interest Rate
4.15%
Mortgage Type
Purchase Money Mortgage
Estimated Equity
$440,908
Purchase Details
Closed on
Nov 4, 2005
Sold by
Comas Nettie and Nunez Josefina
Bought by
Nunez Josefina
Purchase Details
Closed on
Feb 4, 2000
Sold by
Alvarado Giovani
Bought by
Nunez Josefina and Comas Nettie
Home Financials for this Owner
Home Financials are based on the most recent Mortgage that was taken out on this home.
Original Mortgage
$202,500
Interest Rate
8.11%
Purchase Details
Closed on
Jan 23, 1996
Sold by
Citibank Na
Bought by
Alvarado Giovani
Create a Home Valuation Report for This Property
The Home Valuation Report is an in-depth analysis detailing your home's value as well as a comparison with similar homes in the area
Home Values in the Area
Average Home Value in this Area
Purchase History
| Date | Buyer | Sale Price | Title Company |
|---|---|---|---|
| Chasi Jose | $750,000 | -- | |
| Nunez Josefina | $168,000 | -- | |
| Nunez Josefina | $225,000 | First American Title Ins Co | |
| Alvarado Giovani | $140,000 | Titleserv |
Source: Public Records
Mortgage History
| Date | Status | Borrower | Loan Amount |
|---|---|---|---|
| Open | Chasi Jose | $600,000 | |
| Previous Owner | Nunez Josefina | $202,500 |
Source: Public Records
Tax History Compared to Growth
Tax History
| Year | Tax Paid | Tax Assessment Tax Assessment Total Assessment is a certain percentage of the fair market value that is determined by local assessors to be the total taxable value of land and additions on the property. | Land | Improvement |
|---|---|---|---|---|
| 2025 | $5,526 | $28,374 | $6,017 | $22,357 |
| 2024 | $5,526 | $27,515 | $6,053 | $21,462 |
| 2023 | $5,267 | $26,225 | $6,428 | $19,797 |
| 2022 | $4,978 | $43,260 | $10,560 | $32,700 |
| 2021 | $4,976 | $41,160 | $10,560 | $30,600 |
| 2020 | $5,005 | $43,440 | $10,560 | $32,880 |
| 2019 | $4,797 | $43,140 | $10,560 | $32,580 |
| 2018 | $4,455 | $21,854 | $5,305 | $16,549 |
| 2017 | $3,936 | $20,780 | $6,913 | $13,867 |
| 2016 | $3,629 | $20,780 | $6,913 | $13,867 |
| 2015 | $2,145 | $19,704 | $9,419 | $10,285 |
| 2014 | $2,145 | $19,108 | $10,951 | $8,157 |
Source: Public Records
Map
Nearby Homes