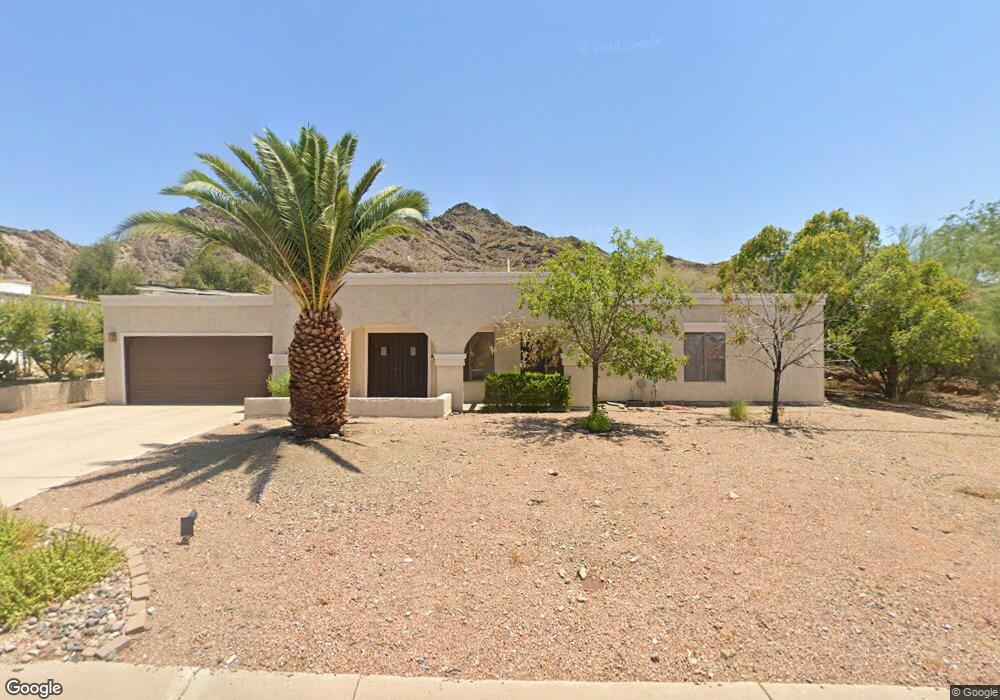
9609 N 17th Place Phoenix, AZ 85020
North Central NeighborhoodEstimated Value: $600,083 - $772,000
--
Bed
2
Baths
1,934
Sq Ft
$351/Sq Ft
Est. Value
About This Home
This home is located at 9609 N 17th Place, Phoenix, AZ 85020 and is currently estimated at $678,271, approximately $350 per square foot. 9609 N 17th Place is a home located in Maricopa County with nearby schools including Mercury Mine Elementary School, Shea Middle School, and Shadow Mountain High School.
Ownership History
Date
Name
Owned For
Owner Type
Purchase Details
Closed on
Apr 21, 1999
Sold by
Boyajian Lance B and Boyajian Mary C
Bought by
Torres Jorge M and Bradford Richard H
Current Estimated Value
Home Financials for this Owner
Home Financials are based on the most recent Mortgage that was taken out on this home.
Original Mortgage
$168,000
Outstanding Balance
$42,257
Interest Rate
6.96%
Mortgage Type
New Conventional
Estimated Equity
$636,014
Purchase Details
Closed on
Dec 28, 1995
Sold by
Lavallee Bruce R and Lavallee Wendy L
Bought by
Boyajian Lance B and Glavosek Mary C
Home Financials for this Owner
Home Financials are based on the most recent Mortgage that was taken out on this home.
Original Mortgage
$110,700
Interest Rate
7.1%
Mortgage Type
New Conventional
Create a Home Valuation Report for This Property
The Home Valuation Report is an in-depth analysis detailing your home's value as well as a comparison with similar homes in the area
Home Values in the Area
Average Home Value in this Area
Purchase History
| Date | Buyer | Sale Price | Title Company |
|---|---|---|---|
| Torres Jorge M | $178,000 | First American Title | |
| Boyajian Lance B | $123,000 | United Title Agency |
Source: Public Records
Mortgage History
| Date | Status | Borrower | Loan Amount |
|---|---|---|---|
| Open | Torres Jorge M | $168,000 | |
| Previous Owner | Boyajian Lance B | $110,700 |
Source: Public Records
Tax History Compared to Growth
Tax History
| Year | Tax Paid | Tax Assessment Tax Assessment Total Assessment is a certain percentage of the fair market value that is determined by local assessors to be the total taxable value of land and additions on the property. | Land | Improvement |
|---|---|---|---|---|
| 2025 | $2,625 | $30,309 | -- | -- |
| 2024 | $2,499 | $28,866 | -- | -- |
| 2023 | $2,499 | $51,800 | $10,360 | $41,440 |
| 2022 | $2,476 | $38,830 | $7,760 | $31,070 |
| 2021 | $2,516 | $34,920 | $6,980 | $27,940 |
| 2020 | $2,430 | $35,120 | $7,020 | $28,100 |
| 2019 | $2,441 | $33,570 | $6,710 | $26,860 |
| 2018 | $2,352 | $34,280 | $6,850 | $27,430 |
| 2017 | $2,247 | $28,500 | $5,700 | $22,800 |
| 2016 | $2,211 | $29,030 | $5,800 | $23,230 |
| 2015 | $2,051 | $25,850 | $5,170 | $20,680 |
Source: Public Records
Map
Nearby Homes
- 9429 N 19th St
- 9219 N 16th Place
- 1517 E Carol Ave
- 9711 N 15th Place
- 1910 E Mountain View Rd Unit 7
- 1515 E Sunnyslope Ln
- 1514 E Turquoise Ave
- 1447 E Mountain View Rd
- 1527 E Mission Ln
- 1432 E Purdue Ave
- 9932 N 16th Place E
- 1540 E Dunlap Ave Unit 2177
- 9015 N 15th Place
- 1407 E Mountain View Rd
- 1402 E Malapai Dr
- 9031 N 14th St
- 10015 N 14th St Unit 7
- 10401 N Cave Creek Rd Unit 254
- 10401 N Cave Creek Rd Unit 152
- 10401 N Cave Creek Rd Unit 216
- 9601 N 17th Place
- 9617 N 17th Place
- 9610 N 17th Place
- 9602 N 17th Place
- 9644 N 18th St Unit 283
- 9644 N 18th St Unit 291
- 9618 N 17th Place
- 9625 N 17th Place
- 1734 E Vogel Ave
- 9654 N 18th St
- 9443 N 17th Place
- 9607 N 17th St
- 9615 N 17th St
- 9639 N 17th Place
- 9631 N 17th Place
- 1702 E Vogel Ave
- 9621 N 17th St
- 9643 N 18th St
- 9662 N 18th St
- 9640 N 18th St Unit 8