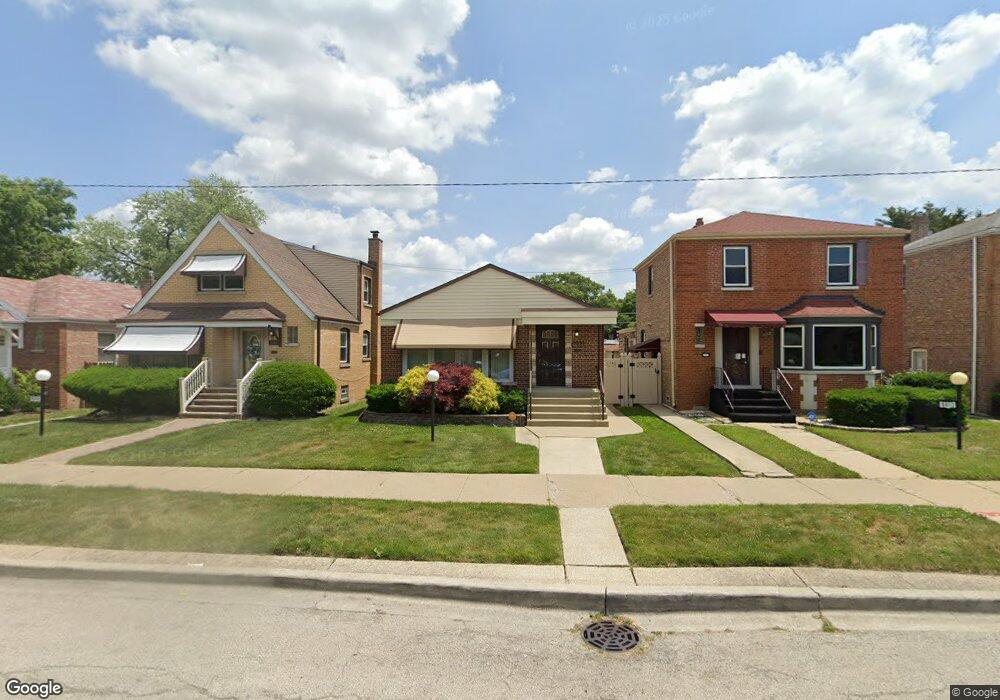
9609 S Green St Chicago, IL 60643
Washington Heights NeighborhoodEstimated Value: $185,201 - $223,000
2
Beds
1
Bath
960
Sq Ft
$206/Sq Ft
Est. Value
About This Home
This home is located at 9609 S Green St, Chicago, IL 60643 and is currently estimated at $197,550, approximately $205 per square foot. 9609 S Green St is a home located in Cook County with nearby schools including Wacker Elementary School, Harlan Community Academy High School, and Oakdale Christian Academy.
Ownership History
Date
Name
Owned For
Owner Type
Purchase Details
Closed on
Aug 22, 2002
Sold by
Embry Stacy R
Bought by
James Takeshi M
Current Estimated Value
Home Financials for this Owner
Home Financials are based on the most recent Mortgage that was taken out on this home.
Original Mortgage
$113,981
Outstanding Balance
$47,748
Interest Rate
6.41%
Mortgage Type
FHA
Estimated Equity
$149,802
Purchase Details
Closed on
May 1, 1997
Sold by
Wolfe Lillian
Bought by
Embry Stacy R
Home Financials for this Owner
Home Financials are based on the most recent Mortgage that was taken out on this home.
Original Mortgage
$77,658
Interest Rate
8.01%
Purchase Details
Closed on
Apr 30, 1997
Sold by
Conrad Helen and Wolfe Marguerite
Bought by
Wolfe Lillian
Home Financials for this Owner
Home Financials are based on the most recent Mortgage that was taken out on this home.
Original Mortgage
$77,658
Interest Rate
8.01%
Purchase Details
Closed on
Feb 18, 1997
Sold by
Wolfe Lillian
Bought by
Conrad Helen and Wolfe Marguerite
Create a Home Valuation Report for This Property
The Home Valuation Report is an in-depth analysis detailing your home's value as well as a comparison with similar homes in the area
Home Values in the Area
Average Home Value in this Area
Purchase History
| Date | Buyer | Sale Price | Title Company |
|---|---|---|---|
| James Takeshi M | $115,000 | -- | |
| Embry Stacy R | $77,500 | -- | |
| Wolfe Lillian | -- | Attorneys Natl Title Network | |
| Conrad Helen | -- | Chicago Title Insurance Co |
Source: Public Records
Mortgage History
| Date | Status | Borrower | Loan Amount |
|---|---|---|---|
| Open | James Takeshi M | $113,981 | |
| Previous Owner | Embry Stacy R | $77,658 |
Source: Public Records
Tax History Compared to Growth
Tax History
| Year | Tax Paid | Tax Assessment Tax Assessment Total Assessment is a certain percentage of the fair market value that is determined by local assessors to be the total taxable value of land and additions on the property. | Land | Improvement |
|---|---|---|---|---|
| 2024 | $1,625 | $9,600 | $3,958 | $5,642 |
| 2023 | $1,563 | $11,001 | $3,125 | $7,876 |
| 2022 | $1,563 | $11,001 | $3,125 | $7,876 |
| 2021 | $1,546 | $10,999 | $3,124 | $7,875 |
| 2020 | $1,534 | $9,972 | $3,124 | $6,848 |
| 2019 | $1,517 | $10,959 | $3,124 | $7,835 |
| 2018 | $1,490 | $10,959 | $3,124 | $7,835 |
| 2017 | $1,536 | $10,496 | $2,707 | $7,789 |
| 2016 | $1,606 | $10,496 | $2,707 | $7,789 |
| 2015 | $1,446 | $10,496 | $2,707 | $7,789 |
| 2014 | $1,471 | $10,477 | $2,499 | $7,978 |
| 2013 | $1,431 | $10,477 | $2,499 | $7,978 |
Source: Public Records
Map
Nearby Homes
- 9562 S Green St
- 9605 S Emerald Ave
- 9720 S Emerald Ave
- 9515 S Peoria St
- 9620 S Sangamon St
- 9647 S Lowe Ave
- 9610 S Wallace St
- 9741 S Lowe Ave
- 9426 S Peoria St
- 608 W 95th St
- 9348 S Green St
- 549 W 95th St
- 520 W 97th St
- 9356 S Union Ave
- 9815 S Carpenter St
- 9919 S Peoria St
- 9430 S Parnell Ave
- 9318 S Peoria St
- 9953 S Peoria St
- 445 W 98th St
- 9605 S Green St
- 9613 S Green St
- 9601 S Green St
- 9615 S Green St
- 9619 S Green St
- 9621 S Green St
- 9612 S Halsted St Unit B
- 9612 S Halsted St
- 9600 S Halsted St
- 9618 S Halsted St
- 9618 S Halsted St
- 9618 S Halsted St
- 9618 S Halsted St Unit B
- 9567 S Green St
- 9625 S Green St
- 9620 S Halsted St
- 9620 S Halsted St
- 9620 S Halsted St
- 9620 S Halsted St Unit B
- 9608 S Green St