
Seller's Agent in 2025
AJ|Abhijit Leekha
Property Economics Inc.
(630) 283-2111
21 in this area
645 Total Sales
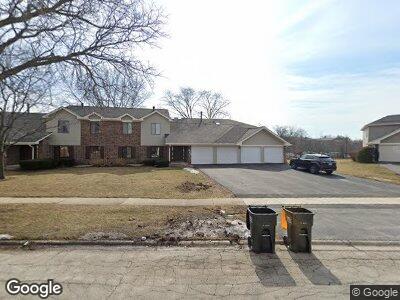
ONE OF THE BEST RENTALS IN THE ENTIRE SUBDIVISION! 2ND FLOOR UNIT WITH ALL THE UPGRADES FROM THE BUILDER. CUL DE SAC LOCATION WITH 1 CAR GARAGE AND 2 ADDITIONAL PARKING ON YOUR DRIVE WAY! FULL HOUSE LUXURY VINYL PLANK FLOORING! FRESHLY PAINTED AND UPGRADED LIGHTING! OPEN CONCEPT LAYOUT WITH SKY LIGHTS IN THE KITCHEN, HIGH END CABINETRY AND APPLIANCES. QUARTZ COUNTERS AND AMAZING BACKSPLASH. MASTER BEDROOM HAS GORGEOUS POND VIEWS. MASTER BATHROOM HAS HIGH CEILINGS WITH SKY LIGHT. LARGE WALK-IN CLOSET. 3 TOTAL BEDROOMS AND 2 FULL BATHS. ROLLER SHADES IN ALL BEDROOMS. STUNNING FINISHES IN EVERY ROOM AND EVERY CORNER. HIGH END MATERIAL ALL THE WAY. LUXURY WASHER AND DRYER IN UNIT. LOCATION IS MINUTES FROM ALL THE HIGHWAYS, SHOPPING, SCHAUMBURG RESTAURANTS, GROCERY AND SO MUCH MORE. WALKING DISTANCE TO METRA! RARE HOME FOR A QUALITY TENANT. AVAILABLE MAY 01, 2025.
| Date | Buyer | Sale Price | Title Company |
|---|---|---|---|
| Amin Manaliben Y | $175,000 | Attorneys Ttl Guaranty Fund |
| Date | Status | Borrower | Loan Amount |
|---|---|---|---|
| Open | Amin Manaliben Y | $157,500 | |
| Previous Owner | Novak John F | $47,500 | |
| Previous Owner | Novak John F | $25,000 |
| Date | Event | Price | Change | Sq Ft Price |
|---|---|---|---|---|
| 05/02/2025 05/02/25 | Rented | $2,400 | 0.0% | -- |
| 04/14/2025 04/14/25 | Under Contract | -- | -- | -- |
| 04/03/2025 04/03/25 | For Rent | $2,400 | +4.3% | -- |
| 06/05/2022 06/05/22 | Rented | $2,300 | 0.0% | -- |
| 05/16/2022 05/16/22 | Under Contract | -- | -- | -- |
| 05/10/2022 05/10/22 | For Rent | $2,300 | -- | -- |
| Year | Tax Paid | Tax Assessment Tax Assessment Total Assessment is a certain percentage of the fair market value that is determined by local assessors to be the total taxable value of land and additions on the property. | Land | Improvement |
|---|---|---|---|---|
| 2024 | $5,558 | $19,825 | $1,309 | $18,516 |
| 2023 | $5,558 | $19,825 | $1,309 | $18,516 |
| 2022 | $5,558 | $19,825 | $1,309 | $18,516 |
| 2021 | $494 | $15,612 | $1,121 | $14,491 |
| 2020 | $453 | $15,612 | $1,121 | $14,491 |
| 2019 | $449 | $17,554 | $1,121 | $16,433 |
| 2018 | $499 | $12,748 | $934 | $11,814 |
| 2017 | $481 | $12,748 | $934 | $11,814 |
| 2016 | $1,083 | $12,748 | $934 | $11,814 |
| 2015 | $1,240 | $12,050 | $822 | $11,228 |
| 2014 | $1,188 | $12,050 | $822 | $11,228 |
| 2013 | $1,179 | $12,050 | $822 | $11,228 |
Seller's Agent in 2025
AJ|Abhijit Leekha
Property Economics Inc.
(630) 283-2111
21 in this area
645 Total Sales
Seller Co-Listing Agent in 2025
Venkata Bobba
Property Economics Inc.
(781) 962-3772
1 Total Sale
Buyer's Agent in 2025
Makbule Sahsivar
HomeSmart Connect LLC
(224) 704-8405
3 in this area
32 Total Sales
Buyer's Agent in 2022
Kalidas Salvi
Remax Future
(847) 882-4855
4 in this area
64 Total Sales