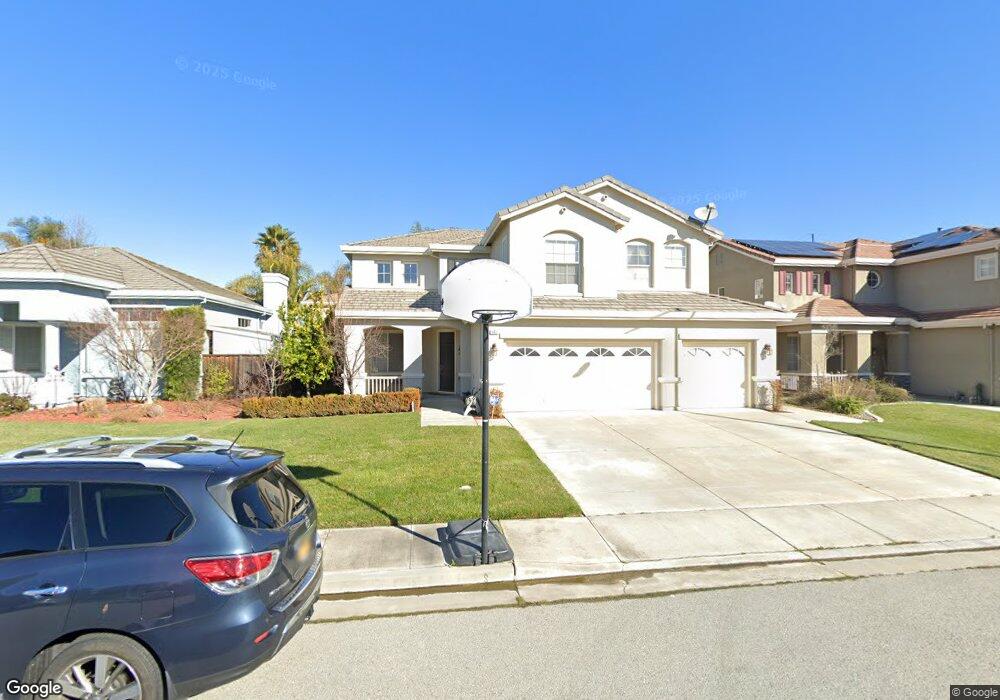
961 Festa Aglio Ct Gilroy, CA 95020
Las Animas NeighborhoodEstimated Value: $1,229,377 - $1,318,000
5
Beds
3
Baths
2,639
Sq Ft
$477/Sq Ft
Est. Value
About This Home
This home is located at 961 Festa Aglio Ct, Gilroy, CA 95020 and is currently estimated at $1,259,344, approximately $477 per square foot. 961 Festa Aglio Ct is a home located in Santa Clara County with nearby schools including Solorsano Middle School, South Valley Middle School, and Christopher High School.
Ownership History
Date
Name
Owned For
Owner Type
Purchase Details
Closed on
Nov 6, 2008
Sold by
Sheena Paramjit S and Sheena Harbhajan K
Bought by
Sheena Paramjit S and Sheena Harbhajan K
Current Estimated Value
Purchase Details
Closed on
Sep 23, 2003
Sold by
Cho David K and Cho Jin Hee
Bought by
Sheena Paramjit S and Sheena Harbhajan K
Home Financials for this Owner
Home Financials are based on the most recent Mortgage that was taken out on this home.
Original Mortgage
$200,000
Outstanding Balance
$92,652
Interest Rate
6.22%
Mortgage Type
Purchase Money Mortgage
Estimated Equity
$1,166,692
Purchase Details
Closed on
Feb 22, 2000
Sold by
Old Orchard Co
Bought by
Cho David K and Cho Jin Hee
Home Financials for this Owner
Home Financials are based on the most recent Mortgage that was taken out on this home.
Original Mortgage
$44,640
Interest Rate
8.16%
Mortgage Type
Unknown
Create a Home Valuation Report for This Property
The Home Valuation Report is an in-depth analysis detailing your home's value as well as a comparison with similar homes in the area
Home Values in the Area
Average Home Value in this Area
Purchase History
| Date | Buyer | Sale Price | Title Company |
|---|---|---|---|
| Sheena Paramjit S | -- | None Available | |
| Sheena Paramjit S | $567,500 | Commonwealth Land Title | |
| Cho David K | $431,000 | Old Republic Title Company |
Source: Public Records
Mortgage History
| Date | Status | Borrower | Loan Amount |
|---|---|---|---|
| Open | Sheena Paramjit S | $200,000 | |
| Previous Owner | Cho David K | $44,640 | |
| Previous Owner | Cho David K | $343,200 |
Source: Public Records
Tax History Compared to Growth
Tax History
| Year | Tax Paid | Tax Assessment Tax Assessment Total Assessment is a certain percentage of the fair market value that is determined by local assessors to be the total taxable value of land and additions on the property. | Land | Improvement |
|---|---|---|---|---|
| 2025 | $9,731 | $806,849 | $322,738 | $484,111 |
| 2024 | $9,731 | $791,029 | $316,410 | $474,619 |
| 2023 | $9,673 | $775,519 | $310,206 | $465,313 |
| 2022 | $9,514 | $760,314 | $304,124 | $456,190 |
| 2021 | $9,471 | $745,407 | $298,161 | $447,246 |
| 2020 | $9,366 | $737,765 | $295,104 | $442,661 |
| 2019 | $9,278 | $723,300 | $289,318 | $433,982 |
| 2018 | $8,660 | $709,119 | $283,646 | $425,473 |
| 2017 | $8,843 | $695,216 | $278,085 | $417,131 |
| 2016 | $8,667 | $681,585 | $272,633 | $408,952 |
| 2015 | $8,175 | $671,348 | $268,538 | $402,810 |
| 2014 | $7,628 | $618,000 | $247,200 | $370,800 |
Source: Public Records
Map
Nearby Homes
- 1206 Sycamore Ct
- 820 Woodcreek Way
- 670 Wickham Ct
- 1297 Chesbro Way
- 9632 Cherrywood Ct
- 1469 Goshawk Ct
- 1620 Welburn Ave
- 1482 Goshawk Ct
- 796 Gary St
- 1486 Swallow Ln
- 958 Bosco Ln Unit 1603
- 1080 Sunrise Dr
- 8190 Westwood Dr
- 8170 Westwood Dr Unit 22
- 8940 Acorn Way
- 1469 Eagles Nest Ln
- 8120 Catalina Ct
- 1555 Hecker Pass Rd Unit D201
- 9135 Desiderio Way
- 9232 Kestrel Ct
- 951 Festa Aglio Ct
- 971 Festa Aglio Ct
- 972 Moro Ct
- 962 Moro Ct
- 941 Festa Aglio Ct
- 981 Festa Aglio Ct
- 952 Moro Ct
- 982 Moro Ct
- 960 Festa Aglio Ct
- 950 Festa Aglio Ct
- 970 Festa Aglio Ct
- 940 Festa Aglio Ct
- 931 Festa Aglio Ct
- 942 Moro Ct
- 980 Festa Aglio Ct
- 930 Festa Aglio Ct
- 932 Moro Ct
- 965 Sorrento Ct
- 959 Sorrento Ct
- 921 Festa Aglio Ct