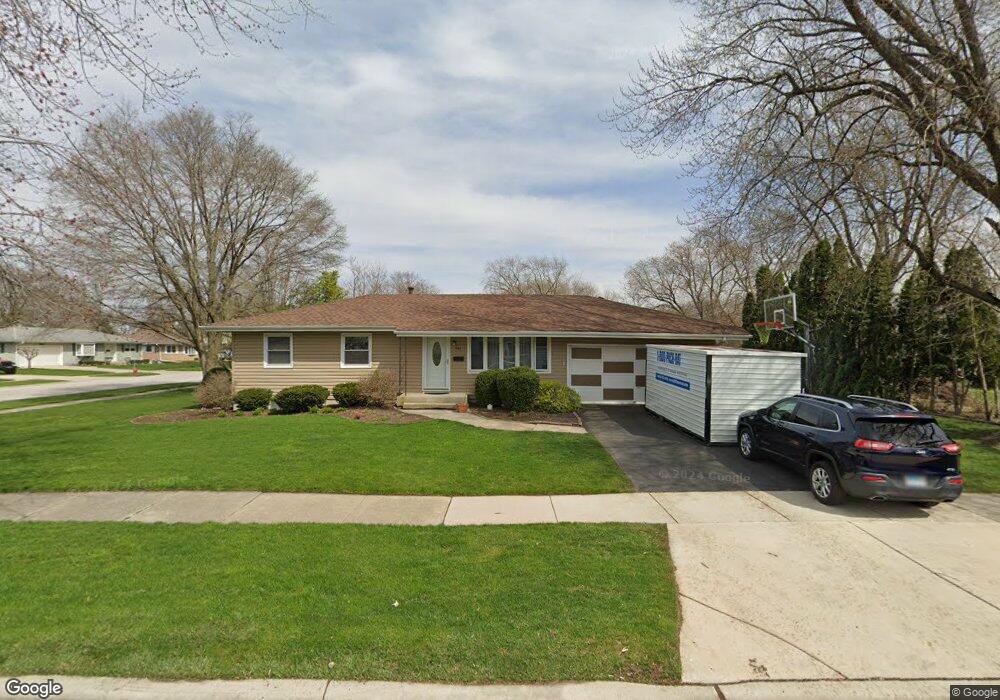
961 Laurel Dr Aurora, IL 60506
Edgelawn Randall NeighborhoodEstimated Value: $272,823 - $306,000
3
Beds
1
Bath
1,040
Sq Ft
$281/Sq Ft
Est. Value
About This Home
This home is located at 961 Laurel Dr, Aurora, IL 60506 and is currently estimated at $291,956, approximately $280 per square foot. 961 Laurel Dr is a home located in Kane County with nearby schools including Hall Elementary School, Jefferson Middle School, and West Aurora High School.
Ownership History
Date
Name
Owned For
Owner Type
Purchase Details
Closed on
Jul 26, 2006
Sold by
Correll John D and Correll Cynthia C
Bought by
Greenbusch Todd M
Current Estimated Value
Home Financials for this Owner
Home Financials are based on the most recent Mortgage that was taken out on this home.
Original Mortgage
$156,000
Outstanding Balance
$100,991
Interest Rate
8.25%
Mortgage Type
Purchase Money Mortgage
Estimated Equity
$190,965
Purchase Details
Closed on
Apr 24, 1998
Sold by
Greenfield Rodney J and Greenfield Christie A
Bought by
Correll John D and Correll Cynthia C
Home Financials for this Owner
Home Financials are based on the most recent Mortgage that was taken out on this home.
Original Mortgage
$93,600
Interest Rate
7.26%
Create a Home Valuation Report for This Property
The Home Valuation Report is an in-depth analysis detailing your home's value as well as a comparison with similar homes in the area
Home Values in the Area
Average Home Value in this Area
Purchase History
| Date | Buyer | Sale Price | Title Company |
|---|---|---|---|
| Greenbusch Todd M | $195,000 | Law Title Insurance Agency | |
| Correll John D | $118,000 | Chicago Title Insurance Co |
Source: Public Records
Mortgage History
| Date | Status | Borrower | Loan Amount |
|---|---|---|---|
| Open | Greenbusch Todd M | $156,000 | |
| Previous Owner | Correll John D | $93,600 |
Source: Public Records
Tax History
| Year | Tax Paid | Tax Assessment Tax Assessment Total Assessment is a certain percentage of the fair market value that is determined by local assessors to be the total taxable value of land and additions on the property. | Land | Improvement |
|---|---|---|---|---|
| 2024 | $5,363 | $75,735 | $15,912 | $59,823 |
| 2023 | $5,111 | $67,669 | $14,217 | $53,452 |
| 2022 | $4,934 | $61,742 | $12,972 | $48,770 |
| 2021 | $4,672 | $57,141 | $12,077 | $45,064 |
| 2020 | $4,407 | $53,076 | $11,218 | $41,858 |
| 2019 | $4,430 | $51,300 | $10,394 | $40,906 |
| 2018 | $4,050 | $46,573 | $9,614 | $36,959 |
| 2017 | $4,383 | $48,585 | $8,858 | $39,727 |
| 2016 | $3,792 | $41,694 | $7,593 | $34,101 |
| 2015 | -- | $35,348 | $6,529 | $28,819 |
| 2014 | -- | $32,017 | $6,279 | $25,738 |
| 2013 | -- | $31,561 | $6,190 | $25,371 |
Source: Public Records
Map
Nearby Homes
- 1930 Richard St Unit 1
- 1071 Almond Dr
- 2140 Sandburg Dr
- 980 Sapphire Ln
- 968 Sapphire Ln
- 960 Sapphire Ln
- 972 Sapphire Ln
- 988 Sapphire Ln
- 976 Sapphire Ln
- 984 Sapphire Ln
- 991 Sapphire Ln
- 959 Sapphire Ln
- 975 Sapphire Ln
- 963 Sapphire Ln
- 987 Sapphire Ln
- 1086 Cascade Dr Unit 1
- 1295 Foxcroft Dr
- 1322 Croton Ct Unit A
- 873 Shady Ln
- 1615 Heather Dr
- 2010 Richard St Unit 1
- 2010 Richard St
- 2023 Robert St
- 960 Laurel Dr
- 2013 Robert St Unit 1
- 1990 Richard St
- 950 Laurel Dr Unit 1
- 2031 Richard St
- 2015 Richard St Unit 2
- 1993 Robert St
- 2041 Richard St
- 2060 Richard St
- 1995 Richard St
- 1980 Richard St
- 2059 Robert St Unit 1
- 2055 Richard St Unit 2
- 1983 Robert St
- 1985 Richard St Unit 2
- 2070 Richard St Unit 1
- 1970 Richard St Unit 1
Your Personal Tour Guide
Ask me questions while you tour the home.