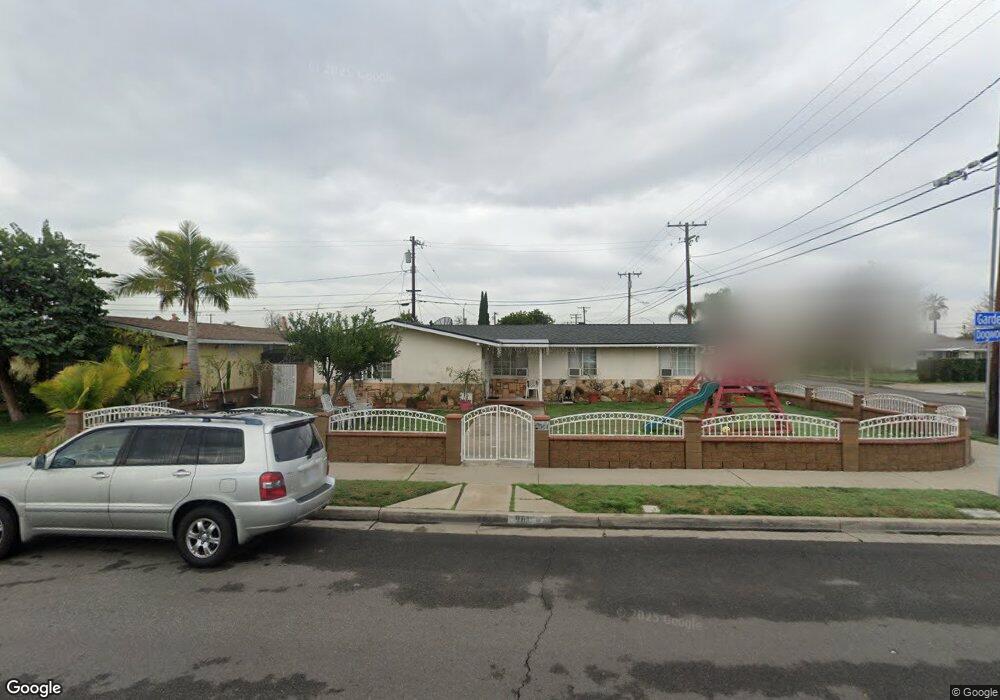
961 N Garden St Anaheim, CA 92801
Northwest Anaheim NeighborhoodEstimated Value: $809,000 - $848,000
4
Beds
2
Baths
1,174
Sq Ft
$703/Sq Ft
Est. Value
About This Home
This home is located at 961 N Garden St, Anaheim, CA 92801 and is currently estimated at $825,058, approximately $702 per square foot. 961 N Garden St is a home located in Orange County with nearby schools including John Marshall Elementary School, Brookhurst Junior High School, and Savanna High School.
Ownership History
Date
Name
Owned For
Owner Type
Purchase Details
Closed on
Jul 17, 2022
Sold by
Thi Pham and Thi Thinh
Bought by
Pat Pham And Thinh Thi Vu Revocable Living Tr
Current Estimated Value
Purchase Details
Closed on
Oct 5, 2020
Sold by
Pham Tammy Thuan
Bought by
Pham Pat and Vu Thinh Thi
Home Financials for this Owner
Home Financials are based on the most recent Mortgage that was taken out on this home.
Original Mortgage
$143,000
Interest Rate
2.8%
Mortgage Type
New Conventional
Purchase Details
Closed on
Mar 22, 2002
Sold by
Vanvannguyen Chuc Van and Pham Mai Thi
Bought by
Pham Tammy Thuan
Purchase Details
Closed on
Mar 2, 1997
Sold by
Vanvannguyen Chuc Van and Lam Nguyen Hai
Bought by
Vanvannguyen Chuc Van and Pham Mai Thi
Purchase Details
Closed on
Sep 26, 1996
Sold by
Pham Mai Thi
Bought by
Vanvannguyen Chuc Van
Purchase Details
Closed on
Jul 4, 1996
Sold by
Van Pham Tuyen
Bought by
Vanvannguyen Chuc Van and Lam Nguyen Hai
Create a Home Valuation Report for This Property
The Home Valuation Report is an in-depth analysis detailing your home's value as well as a comparison with similar homes in the area
Home Values in the Area
Average Home Value in this Area
Purchase History
| Date | Buyer | Sale Price | Title Company |
|---|---|---|---|
| Pat Pham And Thinh Thi Vu Revocable Living Tr | -- | None Listed On Document | |
| Pham Pat | -- | Orange Coast Title Company | |
| Pham Tammy Thuan | -- | Orange Coast Title Company | |
| Vanvannguyen Chuc Van | -- | Gateway Title Company | |
| Vanvannguyen Chuc Van | -- | Southland Title Corporation | |
| Vanvannguyen Chuc Van | -- | Southland Title Corporation |
Source: Public Records
Mortgage History
| Date | Status | Borrower | Loan Amount |
|---|---|---|---|
| Previous Owner | Pham Pat | $143,000 |
Source: Public Records
Tax History Compared to Growth
Tax History
| Year | Tax Paid | Tax Assessment Tax Assessment Total Assessment is a certain percentage of the fair market value that is determined by local assessors to be the total taxable value of land and additions on the property. | Land | Improvement |
|---|---|---|---|---|
| 2025 | $4,052 | $339,768 | $269,127 | $70,641 |
| 2024 | $4,052 | $333,106 | $263,850 | $69,256 |
| 2023 | $3,965 | $326,575 | $258,676 | $67,899 |
| 2022 | $3,914 | $320,172 | $253,604 | $66,568 |
| 2021 | $3,919 | $313,895 | $248,632 | $65,263 |
| 2020 | $3,902 | $310,677 | $246,083 | $64,594 |
| 2019 | $3,789 | $304,586 | $241,258 | $63,328 |
| 2018 | $3,712 | $298,614 | $236,527 | $62,087 |
| 2017 | $3,568 | $292,759 | $231,889 | $60,870 |
| 2016 | $3,558 | $287,019 | $227,342 | $59,677 |
| 2015 | $3,526 | $282,708 | $223,927 | $58,781 |
| 2014 | $3,312 | $277,171 | $219,541 | $57,630 |
Source: Public Records
Map
Nearby Homes
- 1846 W Falmouth Ave Unit 4
- 1854 W Falmouth Ave Unit 3
- 1866 W Falmouth Ave Unit 36
- 1984 W Catalpa Ave
- 615 615 W Romneya
- 1128 N Voyager Ln
- 1384 N Schooner Ln Unit 85
- 1850 W Greenleaf Ave Unit G
- 1302 N Mako Ln Unit 2
- 1802 W Glenoaks Ave
- 1919 W Coronet Ave Unit 122
- 1919 W Coronet Ave Unit 132
- 1919 W Coronet Ave Unit 75
- 1919 W Coronet Ave Unit 208
- 1919 W Coronet Ave Unit 203
- 1919 W Coronet Ave Unit 126
- 1919 W Coronet Ave Unit 221
- 1919 W Coronet Ave Unit 164
- 1919 W Coronet Ave
- 1919 W Coronet Ave Unit 79
- 955 N Garden St
- 2050 W Dogwood Ave
- 954 N Holly St
- 951 N Garden St
- 2045 W Dogwood Ave
- 2041 W Dogwood Ave
- 2030 W Dogwood Ave
- 2051 W Dogwood Ave
- 950 N Holly St
- 954 N Garden St
- 2035 W Dogwood Ave
- 945 N Garden St
- 2055 W Dogwood Ave
- 950 N Garden St
- 944 N Holly St
- 2031 W Dogwood Ave
- 2061 W Dogwood Ave
- 944 N Garden St
- 941 N Garden St
- 2024 W Dogwood Ave