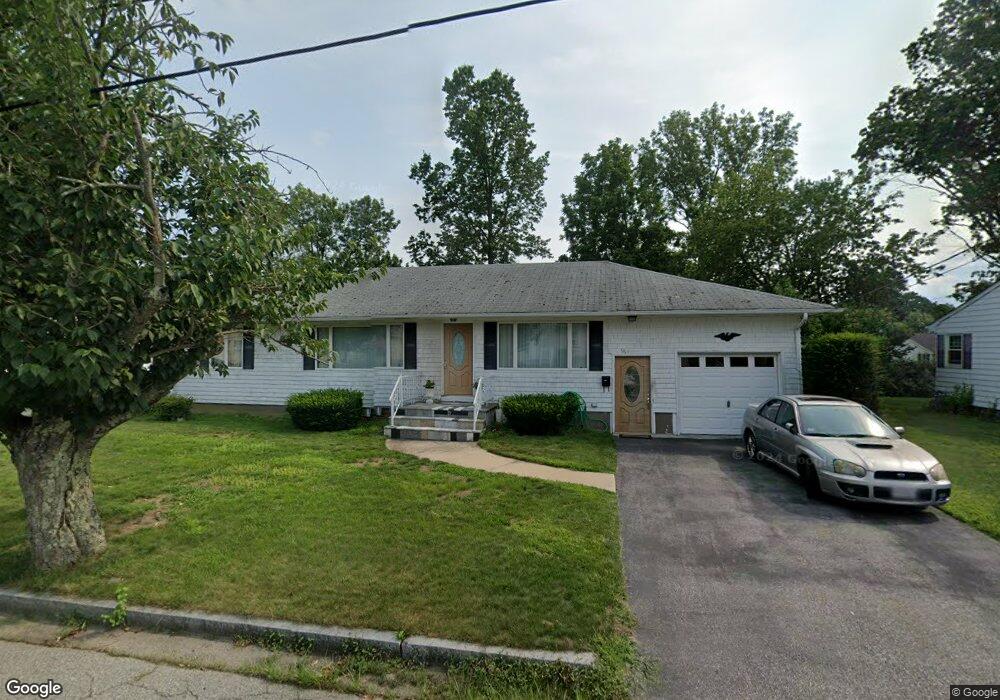
961 Pearce St Fall River, MA 02720
Highlands-Fall River NeighborhoodEstimated Value: $478,000 - $503,000
3
Beds
2
Baths
1,835
Sq Ft
$265/Sq Ft
Est. Value
About This Home
This home is located at 961 Pearce St, Fall River, MA 02720 and is currently estimated at $486,225, approximately $264 per square foot. 961 Pearce St is a home located in Bristol County with nearby schools including Spencer Borden Elementary School, Morton Middle School, and B M C Durfee High School.
Ownership History
Date
Name
Owned For
Owner Type
Purchase Details
Closed on
Mar 15, 2024
Sold by
Fernandes Diamantina and Fernandes Antonio M
Bought by
Fernandes A D Irt and Fernandes
Current Estimated Value
Purchase Details
Closed on
Nov 26, 2022
Sold by
Sousa Ft and Fernandes
Bought by
Fernandes Dianantina and Fernandes Antonio M
Purchase Details
Closed on
Feb 20, 2015
Sold by
Sousa Ft and Sousa
Bought by
Sousa Ft and Sousa
Purchase Details
Closed on
Jan 26, 2004
Sold by
Sousa Arnaldo M and Sousa Maria L
Bought by
Sousa Arnaldo M Est and Sousa
Purchase Details
Closed on
May 6, 1991
Sold by
Burke John A and Burke Margaret M
Bought by
Sousa Arnaldo M and Sousa Maria L
Home Financials for this Owner
Home Financials are based on the most recent Mortgage that was taken out on this home.
Original Mortgage
$57,000
Interest Rate
9.55%
Mortgage Type
Purchase Money Mortgage
Create a Home Valuation Report for This Property
The Home Valuation Report is an in-depth analysis detailing your home's value as well as a comparison with similar homes in the area
Home Values in the Area
Average Home Value in this Area
Purchase History
We collect this data history from publicly available records. To have your information removed, we recommend requesting removal directly through your county’s website.
| Date | Buyer | Sale Price | Title Company |
|---|---|---|---|
| Fernandes A D Irt | -- | None Available | |
| Fernandes Dianantina | -- | None Available | |
| Sousa Ft | -- | -- | |
| Sousa Arnaldo M Est | -- | -- | |
| Sousa Arnaldo M | $117,000 | -- |
Source: Public Records
Mortgage History
We collect this data history from publicly available records. To have your information removed, we recommend requesting removal directly through your county’s website.
| Date | Status | Borrower | Loan Amount |
|---|---|---|---|
| Previous Owner | Sousa Arnaldo M | $57,000 |
Source: Public Records
Tax History
| Year | Tax Paid | Tax Assessment Tax Assessment Total Assessment is a certain percentage of the fair market value that is determined by local assessors to be the total taxable value of land and additions on the property. | Land | Improvement |
|---|---|---|---|---|
| 2025 | $4,540 | $396,500 | $142,800 | $253,700 |
| 2024 | $4,249 | $369,800 | $137,300 | $232,500 |
| 2023 | $3,966 | $323,200 | $118,700 | $204,500 |
| 2022 | $3,510 | $278,100 | $111,000 | $167,100 |
| 2021 | $3,459 | $250,100 | $111,300 | $138,800 |
| 2020 | $3,413 | $236,200 | $111,600 | $124,600 |
| 2019 | $3,349 | $229,700 | $113,300 | $116,400 |
| 2018 | $3,399 | $232,500 | $119,600 | $112,900 |
| 2017 | $3,149 | $224,900 | $113,900 | $111,000 |
| 2016 | $3,023 | $221,800 | $116,200 | $105,600 |
| 2015 | $2,718 | $207,800 | $102,200 | $105,600 |
| 2014 | $2,614 | $207,800 | $102,200 | $105,600 |
Source: Public Records
Map
Nearby Homes
- 45 Read St
- 301 Madison St
- 32 Oakland St
- 1231 Robeson St
- 79 Woodlawn St
- 47 Summerfield St
- 51 Summerfield St
- 554 Madison St
- 37 Shawmut St
- 36 Mcclure Place
- 434 Linden St Unit 2
- 630 Maple St
- 724 High St
- 710 High St
- 333 Langley St
- 243 Robeson St Unit 6
- 243 Robeson St Unit 3
- 1163 New Boston Rd
- 1576 N Main St
- 609 Cherry St
Your Personal Tour Guide
Ask me questions while you tour the home.