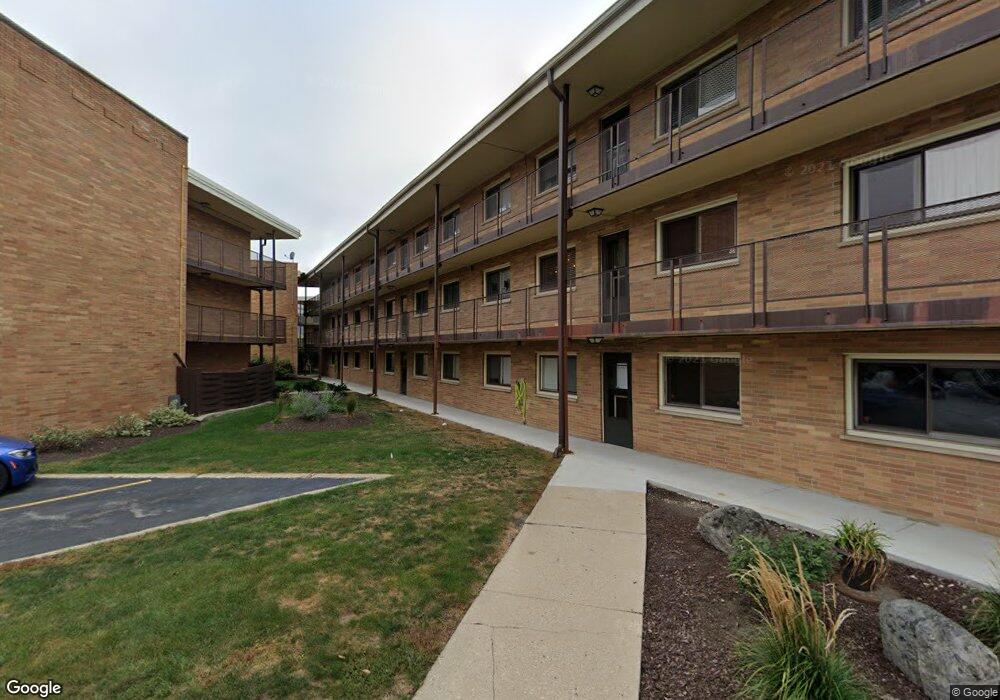
9610 W Higgins Rd Unit 3A Rosemont, IL 60018
Estimated Value: $157,707 - $217,000
1
Bed
--
Bath
907
Sq Ft
$214/Sq Ft
Est. Value
About This Home
This home is located at 9610 W Higgins Rd Unit 3A, Rosemont, IL 60018 and is currently estimated at $193,927, approximately $213 per square foot. 9610 W Higgins Rd Unit 3A is a home located in Cook County with nearby schools including Rosemont Elementary School, East Leyden High School, and Mary, Seat Of Wisdom School.
Ownership History
Date
Name
Owned For
Owner Type
Purchase Details
Closed on
Apr 21, 1997
Sold by
Pittro Michael L and Pittro Michael F
Bought by
Hossa George W and Schultz Linda S
Current Estimated Value
Home Financials for this Owner
Home Financials are based on the most recent Mortgage that was taken out on this home.
Original Mortgage
$80,000
Interest Rate
7.92%
Purchase Details
Closed on
Sep 17, 1993
Sold by
Baptiste Bruce P
Bought by
Pittro Michael L and Pittro Michael F
Home Financials for this Owner
Home Financials are based on the most recent Mortgage that was taken out on this home.
Original Mortgage
$40,000
Interest Rate
7.15%
Create a Home Valuation Report for This Property
The Home Valuation Report is an in-depth analysis detailing your home's value as well as a comparison with similar homes in the area
Home Values in the Area
Average Home Value in this Area
Purchase History
| Date | Buyer | Sale Price | Title Company |
|---|---|---|---|
| Hossa George W | $105,000 | Chicago Title Insurance Co | |
| Pittro Michael L | $57,000 | -- |
Source: Public Records
Mortgage History
| Date | Status | Borrower | Loan Amount |
|---|---|---|---|
| Previous Owner | Hossa George W | $80,000 | |
| Previous Owner | Pittro Michael L | $40,000 |
Source: Public Records
Tax History Compared to Growth
Tax History
| Year | Tax Paid | Tax Assessment Tax Assessment Total Assessment is a certain percentage of the fair market value that is determined by local assessors to be the total taxable value of land and additions on the property. | Land | Improvement |
|---|---|---|---|---|
| 2024 | $1,507 | $11,814 | $1,150 | $10,664 |
| 2023 | $1,504 | $11,814 | $1,150 | $10,664 |
| 2022 | $1,504 | $11,814 | $1,150 | $10,664 |
| 2021 | $1,553 | $11,125 | $814 | $10,311 |
| 2020 | $1,665 | $11,125 | $814 | $10,311 |
| 2019 | $1,529 | $12,364 | $814 | $11,550 |
| 2018 | $1,582 | $12,006 | $718 | $11,288 |
| 2017 | $1,645 | $12,006 | $718 | $11,288 |
| 2016 | $1,977 | $12,006 | $718 | $11,288 |
| 2015 | $1,874 | $11,571 | $622 | $10,949 |
| 2014 | $2,381 | $11,571 | $622 | $10,949 |
| 2013 | $2,266 | $11,571 | $622 | $10,949 |
Source: Public Records
Map
Nearby Homes
- 9614 W Higgins Rd Unit 3A
- 2993 Curtis St Unit C41
- 1840 Nimitz Dr
- 2500 Windsor Mall Unit 1J
- 500 Thames Pkwy Unit 1F
- 2300 Windsor Mall Unit 1F
- 2300 Windsor Mall Unit 2E
- 2609 Eisenhower Dr
- 2166 Laura Ln
- 1757 Farwell Ave
- 414 S Dee Rd Unit 13
- 1966 Laura Ln
- 200 Thames Pkwy Unit 1
- 2646 Maple St
- 38 E Touhy Ave
- 929 S Aldine Ave
- 1219 S Western Ave
- 60 S Dee Rd Unit G
- 516 Engel Blvd
- 20 S Dee Rd
- 9610 W Higgins Rd Unit 1C
- 9612 W Higgins Rd Unit 3F
- 9610 W Higgins Rd Unit 1B
- 9612 W Higgins Rd Unit 1F
- 9612 W Higgins Rd Unit 1D
- 9612 W Higgins Rd Unit 2F
- 9610 W Higgins Rd Unit 3B
- 9610 W Higgins Rd Unit 2B
- 9612 W Higgins Rd Unit 2D
- 9612 W Higgins Rd Unit 1E
- 9612 W Higgins Rd Unit 3E
- 9612 W Higgins Rd Unit 3D
- 9610 W Higgins Rd Unit 1A
- 9610 W Higgins Rd Unit 3C
- 9612 W Higgins Rd Unit 2E
- 9610 W Higgins Rd Unit 2A
- 9610 W Higgins Rd Unit 2C
- 9606 W Higgins Rd Unit 3C
- 9606 W Higgins Rd Unit 3F
- 9606 W Higgins Rd Unit 2D