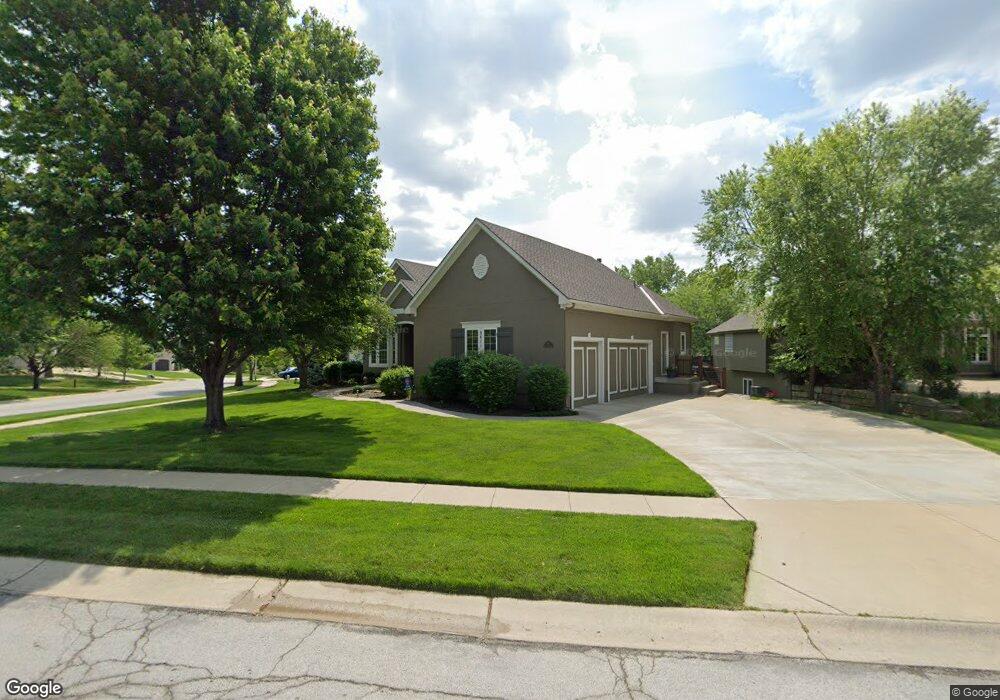
9611 Deer Run St Lenexa, KS 66220
Estimated Value: $752,000 - $872,000
4
Beds
4
Baths
2,497
Sq Ft
$319/Sq Ft
Est. Value
About This Home
This home is located at 9611 Deer Run St, Lenexa, KS 66220 and is currently estimated at $797,363, approximately $319 per square foot. 9611 Deer Run St is a home located in Johnson County with nearby schools including Manchester Park Elementary School, Prairie Trail Middle School, and Olathe Northwest High School.
Ownership History
Date
Name
Owned For
Owner Type
Purchase Details
Closed on
Jun 30, 2021
Sold by
Cassidy Kurt D and Cassidy Elizabeth A
Bought by
Cassidy Kurt D and Cassidy Elizabeth A
Current Estimated Value
Purchase Details
Closed on
Nov 10, 2003
Sold by
Custom Homes Of Kansas City Inc
Bought by
Cassidy Kurt D and Cassidy Elizabeth A
Home Financials for this Owner
Home Financials are based on the most recent Mortgage that was taken out on this home.
Original Mortgage
$435,000
Outstanding Balance
$190,965
Interest Rate
5.81%
Mortgage Type
Construction
Estimated Equity
$606,398
Purchase Details
Closed on
Nov 2, 2003
Sold by
Royal Heights Inc
Bought by
Custom Homes Of Kansas City Inc
Home Financials for this Owner
Home Financials are based on the most recent Mortgage that was taken out on this home.
Original Mortgage
$435,000
Outstanding Balance
$190,965
Interest Rate
5.81%
Mortgage Type
Construction
Estimated Equity
$606,398
Create a Home Valuation Report for This Property
The Home Valuation Report is an in-depth analysis detailing your home's value as well as a comparison with similar homes in the area
Home Values in the Area
Average Home Value in this Area
Purchase History
We collect this data history from publicly available records. To have your information removed, we recommend requesting removal directly through your county’s website.
| Date | Buyer | Sale Price | Title Company |
|---|---|---|---|
| Cassidy Kurt D | -- | None Available | |
| Cassidy Kurt D | -- | Security Land Title Company | |
| Custom Homes Of Kansas City Inc | -- | Security Land Title Company |
Source: Public Records
Mortgage History
We collect this data history from publicly available records. To have your information removed, we recommend requesting removal directly through your county’s website.
| Date | Status | Borrower | Loan Amount |
|---|---|---|---|
| Open | Cassidy Kurt D | $435,000 |
Source: Public Records
Tax History
| Year | Tax Paid | Tax Assessment Tax Assessment Total Assessment is a certain percentage of the fair market value that is determined by local assessors to be the total taxable value of land and additions on the property. | Land | Improvement |
|---|---|---|---|---|
| 2025 | $10,871 | $95,151 | $15,060 | $80,091 |
| 2024 | $10,871 | $88,205 | $15,060 | $73,145 |
| 2023 | $10,188 | $81,421 | $13,099 | $68,322 |
| 2022 | $9,973 | $77,752 | $12,465 | $65,287 |
| 2021 | $9,162 | $68,103 | $12,465 | $55,638 |
| 2020 | $8,870 | $65,286 | $12,465 | $52,821 |
| 2019 | $8,929 | $65,240 | $9,437 | $55,803 |
| 2018 | $9,304 | $67,264 | $9,437 | $57,827 |
| 2017 | $8,930 | $63,158 | $8,582 | $54,576 |
| 2016 | $8,392 | $60,697 | $8,582 | $52,115 |
| 2015 | $8,287 | $59,961 | $8,582 | $51,379 |
| 2013 | -- | $58,362 | $8,582 | $49,780 |
Source: Public Records
Map
Nearby Homes
- 9450 Marion St
- 22201 W 94th Terrace
- 22129 W 94th Terrace
- 22164 W 94th Terrace
- 22093 W 94th Terrace
- 22092 W 94th Terrace
- 22117 W 94th Terrace
- 22165 W 94th Terrace
- 22116 W 94th Terrace
- 21303 W 94th Terrace
- 9410 Deer Run St
- 21617 W 97th Terrace
- 21384 W 93rd Ct
- 8285 Brockway St
- 20823 W 94th St
- 20810 W 94th St
- 9914 Woodstock St
- 22141 W 94th Terrace
- 20816 W 99th St
- 22076 W 99th Terrace
- 21311 W 96th Terrace
- 9623 Deer Run St
- 21314 W 96th Terrace
- 21310 W 96th Terrace
- 21307 W 96th Terrace
- 9605 Deer Run St
- 9610 Deer Run St
- 9629 Deer Run St
- 9614 Deer Run St
- 9606 Deer Run St
- 21306 W 96th Terrace
- 9618 Deer Run St
- 21301 W 96th Terrace
- 9601 Deer Run St
- 9622 Deer Run St
- 9633 Deer Run St
- 9602 Deer Run St
- 21300 W 96th Terrace
- 9626 Deer Run St
- 21227 W 96th Terrace
Your Personal Tour Guide
Ask me questions while you tour the home.