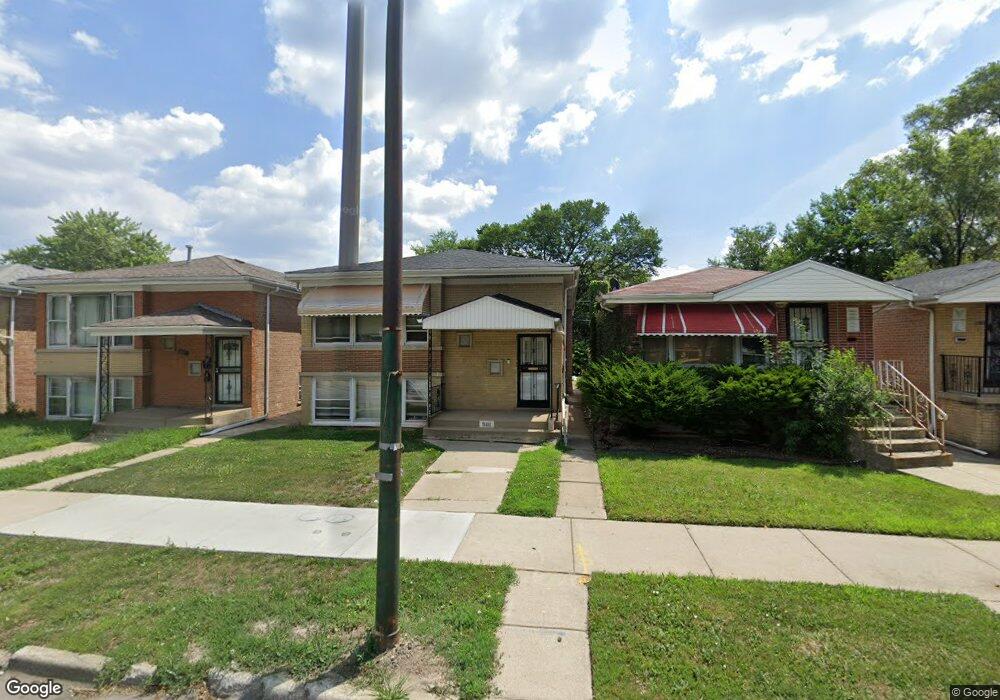
9611 S Halsted St Chicago, IL 60628
Washington Heights NeighborhoodEstimated Value: $164,000 - $227,000
5
Beds
2
Baths
1,156
Sq Ft
$166/Sq Ft
Est. Value
About This Home
This home is located at 9611 S Halsted St, Chicago, IL 60628 and is currently estimated at $192,368, approximately $166 per square foot. 9611 S Halsted St is a home located in Cook County with nearby schools including Evers Elementary School, Harlan Community Academy High School, and CICS - Longwood Campus.
Ownership History
Date
Name
Owned For
Owner Type
Purchase Details
Closed on
Feb 15, 2019
Sold by
Peterson Gregory and Peterson Gary
Bought by
Tillman Dwayne
Current Estimated Value
Home Financials for this Owner
Home Financials are based on the most recent Mortgage that was taken out on this home.
Original Mortgage
$7,500
Interest Rate
3.82%
Mortgage Type
Second Mortgage Made To Cover Down Payment
Purchase Details
Closed on
Feb 13, 2019
Sold by
Topp Benjamin
Bought by
Tillman Dwayne
Home Financials for this Owner
Home Financials are based on the most recent Mortgage that was taken out on this home.
Original Mortgage
$7,500
Interest Rate
3.82%
Mortgage Type
Second Mortgage Made To Cover Down Payment
Purchase Details
Closed on
Mar 23, 2002
Sold by
Peterson Theazo
Bought by
Peterson Gary A
Create a Home Valuation Report for This Property
The Home Valuation Report is an in-depth analysis detailing your home's value as well as a comparison with similar homes in the area
Home Values in the Area
Average Home Value in this Area
Purchase History
| Date | Buyer | Sale Price | Title Company |
|---|---|---|---|
| Tillman Dwayne | -- | North American Title Co | |
| Tillman Dwayne | -- | North American Title Co | |
| Tillman Dwayne | $104,000 | North American Title Co | |
| Peterson Gary A | -- | -- |
Source: Public Records
Mortgage History
| Date | Status | Borrower | Loan Amount |
|---|---|---|---|
| Previous Owner | Tillman Dwayne | $7,500 | |
| Previous Owner | Tillman Dwayne | $102,116 |
Source: Public Records
Tax History Compared to Growth
Tax History
| Year | Tax Paid | Tax Assessment Tax Assessment Total Assessment is a certain percentage of the fair market value that is determined by local assessors to be the total taxable value of land and additions on the property. | Land | Improvement |
|---|---|---|---|---|
| 2024 | $2,538 | $14,000 | $3,078 | $10,922 |
| 2023 | $2,476 | $12,000 | $2,430 | $9,570 |
| 2022 | $2,476 | $12,000 | $2,430 | $9,570 |
| 2021 | $2,420 | $12,000 | $2,430 | $9,570 |
| 2020 | $1,759 | $7,877 | $2,430 | $5,447 |
| 2019 | $1,053 | $8,656 | $2,430 | $6,226 |
| 2018 | $898 | $8,656 | $2,430 | $6,226 |
| 2017 | $2,610 | $12,097 | $2,106 | $9,991 |
| 2016 | $2,429 | $12,097 | $2,106 | $9,991 |
| 2015 | $2,222 | $12,097 | $2,106 | $9,991 |
| 2014 | $2,042 | $10,978 | $1,944 | $9,034 |
| 2013 | $2,001 | $10,978 | $1,944 | $9,034 |
Source: Public Records
Map
Nearby Homes
- 9562 S Green St
- 9720 S Emerald Ave
- 9515 S Peoria St
- 9647 S Lowe Ave
- 9610 S Wallace St
- 9620 S Sangamon St
- 9741 S Lowe Ave
- 9426 S Peoria St
- 608 W 95th St
- 9423 S Sangamon St
- 549 W 95th St
- 9348 S Green St
- 520 W 97th St
- 9430 S Parnell Ave
- 9318 S Peoria St
- 9919 S Peoria St
- 9815 S Carpenter St
- 9328 S Parnell Ave
- 9606 S Eggleston Ave
- 9407 S Normal Ave
- 9613 S Halsted St
- 9607 S Halsted St
- 9615 S Halsted St
- 9605 S Halsted St
- 9619 S Halsted St
- 9619 S Halsted St Unit 3
- 9603 S Halsted St
- 9601 S Halsted St
- 9621 S Halsted St
- 9612 S Emerald Ave
- 9604 S Emerald Ave
- 9616 S Emerald Ave
- 9625 S Halsted St Unit 2
- 9625 S Halsted St
- 9625 S Halsted St
- 9600 S Emerald Ave
- 9620 S Emerald Ave
- 9629 S Halsted St
- 9624 S Emerald Ave
- 9631 S Halsted St