
Seller's Agent in 2025
Heiner & Natalia Escobar
KW College Park
(310) 569-8361
4 in this area
67 Total Sales
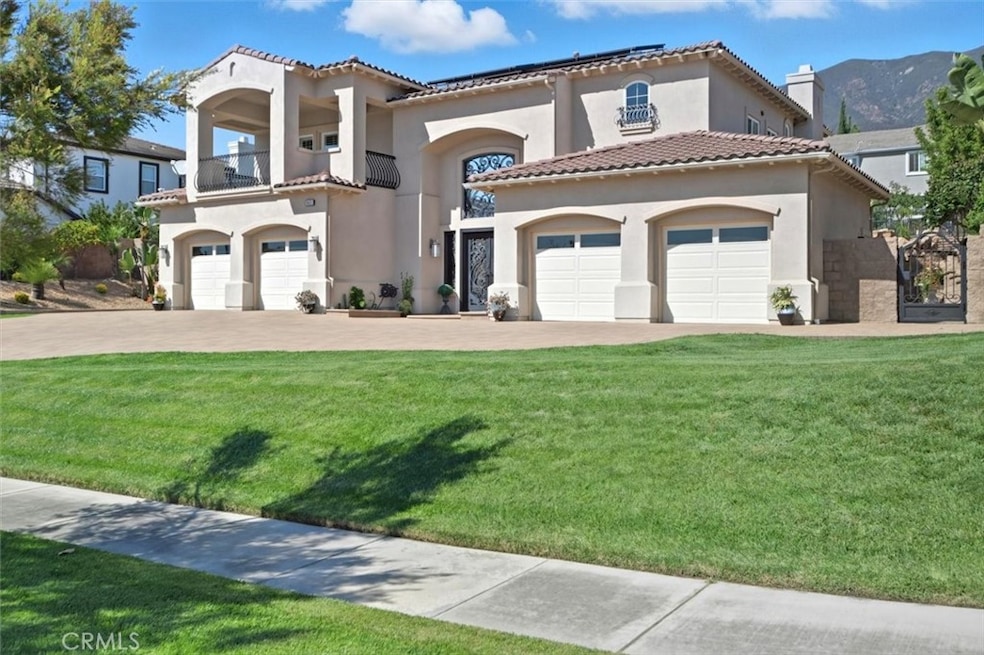
Welcome to 9612 Enclave Drive, an extraordinary Toll Brothers estate tucked away in a peaceful corner lot within the prestigious Alta Loma community of Rancho Cucamonga. Part of the exclusive Carlsbad Series, this residence embodies luxury, craftsmanship, and California living at its finest. Spanning 4,671 square feet of meticulously designed space on a half-acre lot, this home features 5 spacious bedrooms plus a den/ office and 5.5 bathrooms, each bedroom with its own private en-suite. 3 fireplaces located in the formal living room, family room, and the primary suite. Step through the grand double doors into a dramatic two-story foyer with soaring 30-foot ceilings and an elegant dual circular staircase that sets the tone for the grandeur within. The gourmet kitchen is a chef’s dream, featuring a large granite island, high-end stainless steel appliances—including dual ovens and a 6-burner cooktop—a walk-in pantry, butler’s pantry with wine chiller, and a charming breakfast nook that opens to the family room. The luxurious primary suite serves as a private retreat with a spacious sitting area, custom built-ins, and a spa-inspired bathroom offering a Roman tub, dual-head walk-in shower, and dual water closets. Upstairs, enjoy two private balconies with breathtaking mountain and city-light views. Outside, your private resort oasis awaits. The heated pool and spa invite year-round enjoyment, complemented by inviting lounge areas ideal for entertaining or unwinding. The beautifully landscaped backyard features drought-tolerant greenery, towering palms, and a bountiful collection of fruit trees including longan, pomelo, mango, kumquat, orange, and both soft and crunchy persimmon—creating a serene and abundant garden setting. Additional highlights include a main-level mother-in-law suite, library/office, and a spacious laundry room with sink. Custom drapes and blinds accent the home throughout formal living room and dining room and a paid off solar agreement. Situated in an equestrian-friendly community with direct access to horse trails, this estate offers the perfect blend of privacy, elegance, and outdoor lifestyle. With no HOA, no Mello-Roos, and a low tax rate, 9612 Enclave Drive represents a rare opportunity to own a true Rancho Cucamonga gem—where grandeur meets functionality, and nature meets luxury.
Last Agent to Sell the Property
KW College Park Brokerage Phone: 951-901-5997 License #01758326 Listed on: 10/08/2025
Co-Listed By
KELLER WILLIAMS REALTY COLLEGE PARK Brokerage Phone: 951-901-5997 License #01751260
| Date | Type | Sale Price | Title Company |
|---|---|---|---|
| Grant Deed | $2,125,000 | Wfg National Title Company | |
| Interfamily Deed Transfer | -- | None Available | |
| Interfamily Deed Transfer | -- | Orange Coast Title Company | |
| Interfamily Deed Transfer | -- | None Available | |
| Grant Deed | $1,000,000 | Fidelity National Title |
| Date | Status | Loan Amount | Loan Type |
|---|---|---|---|
| Previous Owner | $510,000 | New Conventional | |
| Previous Owner | $800,000 | Purchase Money Mortgage |
| Date | Event | Price | List to Sale | Price per Sq Ft |
|---|---|---|---|---|
| 11/12/2025 11/12/25 | Sold | $2,125,000 | -5.6% | $455 / Sq Ft |
| 10/30/2025 10/30/25 | For Sale | $2,250,000 | +5.9% | $482 / Sq Ft |
| 10/27/2025 10/27/25 | Off Market | $2,125,000 | -- | -- |
| 10/26/2025 10/26/25 | Pending | -- | -- | -- |
| 10/22/2025 10/22/25 | For Sale | $2,250,000 | 0.0% | $482 / Sq Ft |
| 10/17/2025 10/17/25 | Pending | -- | -- | -- |
| 10/17/2025 10/17/25 | For Sale | $2,250,000 | +5.9% | $482 / Sq Ft |
| 10/16/2025 10/16/25 | Off Market | $2,125,000 | -- | -- |
| 10/08/2025 10/08/25 | For Sale | $2,250,000 | -- | $482 / Sq Ft |
| Year | Tax Paid | Tax Assessment Tax Assessment Total Assessment is a certain percentage of the fair market value that is determined by local assessors to be the total taxable value of land and additions on the property. | Land | Improvement |
|---|---|---|---|---|
| 2025 | $14,607 | $1,316,166 | $450,719 | $865,447 |
| 2024 | $14,241 | $1,290,358 | $441,881 | $848,477 |
| 2023 | $13,921 | $1,265,057 | $433,217 | $831,840 |
| 2022 | $13,886 | $1,240,252 | $424,723 | $815,529 |
| 2021 | $13,881 | $1,215,933 | $416,395 | $799,538 |
| 2020 | $13,311 | $1,203,465 | $412,125 | $791,340 |
| 2019 | $13,462 | $1,179,868 | $404,044 | $775,824 |
| 2018 | $13,161 | $1,156,734 | $396,122 | $760,612 |
| 2017 | $12,562 | $1,134,053 | $388,355 | $745,698 |
| 2016 | $12,221 | $1,111,816 | $380,740 | $731,076 |
| 2015 | $11,660 | $1,051,000 | $368,000 | $683,000 |
| 2014 | $9,914 | $900,000 | $315,000 | $585,000 |
Seller's Agent in 2025
Heiner & Natalia Escobar
KW College Park
(310) 569-8361
4 in this area
67 Total Sales
N
Seller Co-Listing Agent in 2025
Natalia Escobar
KELLER WILLIAMS REALTY COLLEGE PARK
(951) 442-8237
2 in this area
5 Total Sales
Buyer's Agent in 2025
Pepper Chen
Elpis Realty Inc
(626) 610-6661
6 in this area
117 Total Sales
Source: California Regional Multiple Listing Service (CRMLS)
MLS Number: IG25227660
APN: 1061-561-36
Disclaimer: Certain information contained herein is derived from information provided by parties other than Homes.com. All information provided is deemed reliable, but is not guaranteed to be accurate and should be independently verified.
![]() The multiple listing data appearing on this website, or contained in reports produced therefrom, is owned and copyrighted by California Regional Multiple Listing Service, Inc. ("CRMLS") and is protected by all applicable copyright laws. Information provided is for viewer's personal, non-commercial use and may not be used for any purpose other than to identify prospective properties the viewer may be interested in purchasing. All listing data, including but not limited to square footage and lot size is believed to be accurate, but the listing Agent, listing Broker and CRMLS and its affiliates do not warrant or guarantee such accuracy. The viewer should independently verify the listed data prior to making any decisions based on such information by personal inspection and/or contacting a real estate professional.
The multiple listing data appearing on this website, or contained in reports produced therefrom, is owned and copyrighted by California Regional Multiple Listing Service, Inc. ("CRMLS") and is protected by all applicable copyright laws. Information provided is for viewer's personal, non-commercial use and may not be used for any purpose other than to identify prospective properties the viewer may be interested in purchasing. All listing data, including but not limited to square footage and lot size is believed to be accurate, but the listing Agent, listing Broker and CRMLS and its affiliates do not warrant or guarantee such accuracy. The viewer should independently verify the listed data prior to making any decisions based on such information by personal inspection and/or contacting a real estate professional.
Based on information from California Regional Multiple Listing Service, Inc. and /or other sources. All data, including all measurements and calculations of area, is obtained from various sources and has not been, and will not be, verified by broker or MLS. All information should be independently reviewed and verified for accuracy. Properties may or may not be listed by the office/agent presenting the information
Ask me questions while you tour the home.